


Gregory Travis
@gregorytravis.com
Writer & Columnist for IEEE. COVID data geek. Political junkie. Midwesterner
Working on a book about engineering, ethics and responsibility in the age of fraud
Working on a book about engineering, ethics and responsibility in the age of fraud
This suggests that something other than COVID is responsible for the excess deaths now, or that deaths caused by SARS-CoV-2 infection in children are being wrongly attributed to some other pathogen on death certificates
June 4, 2025 at 2:01 PM
This suggests that something other than COVID is responsible for the excess deaths now, or that deaths caused by SARS-CoV-2 infection in children are being wrongly attributed to some other pathogen on death certificates
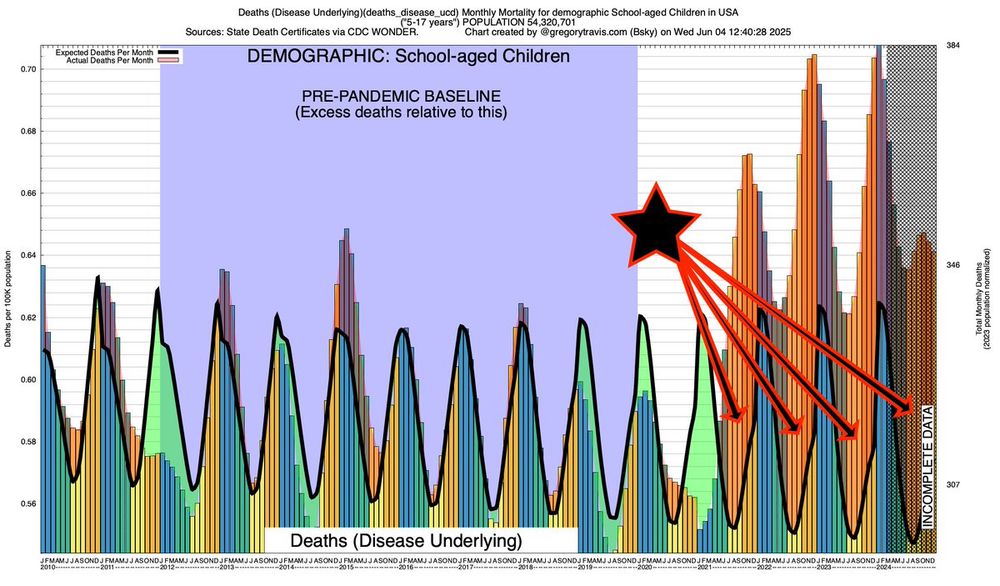
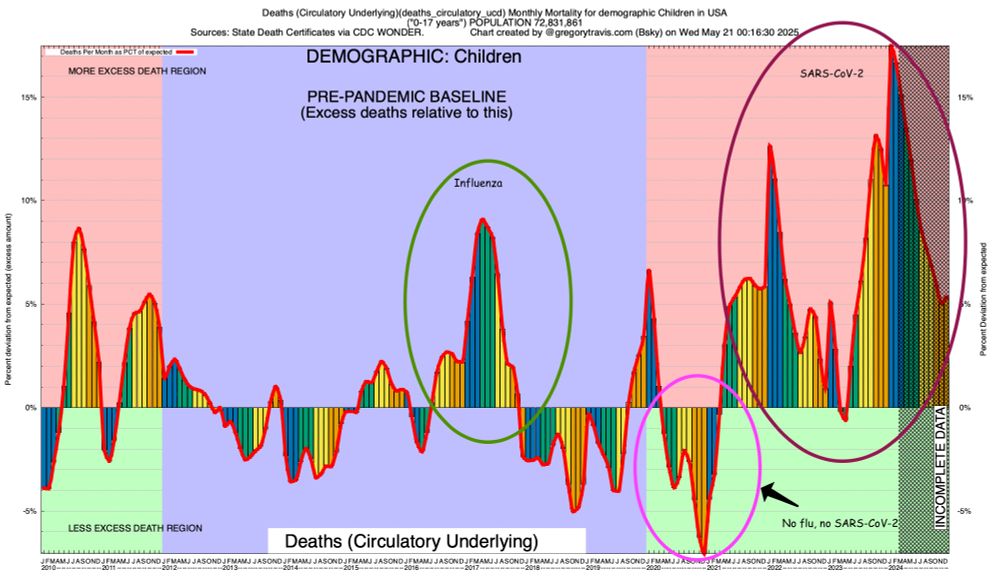
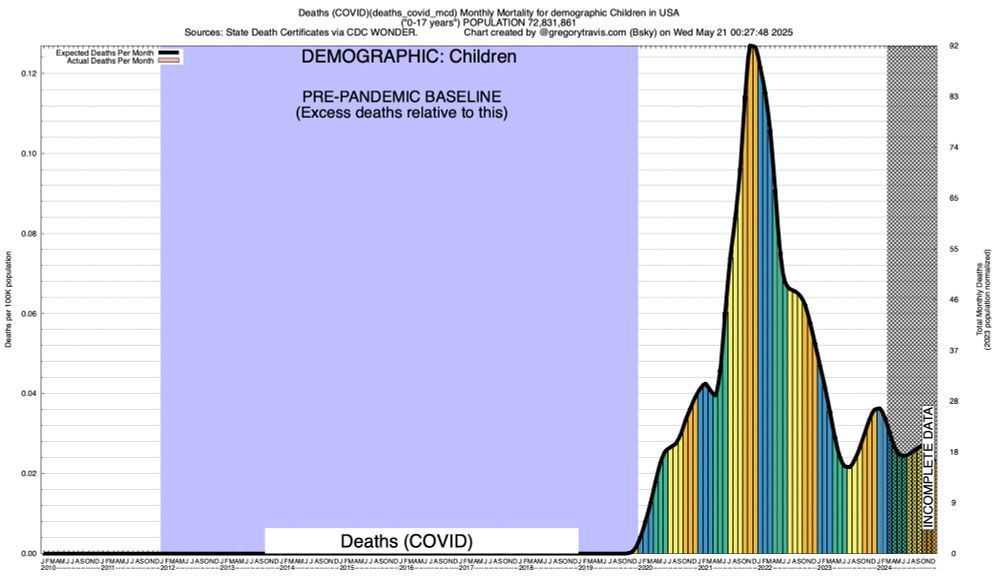
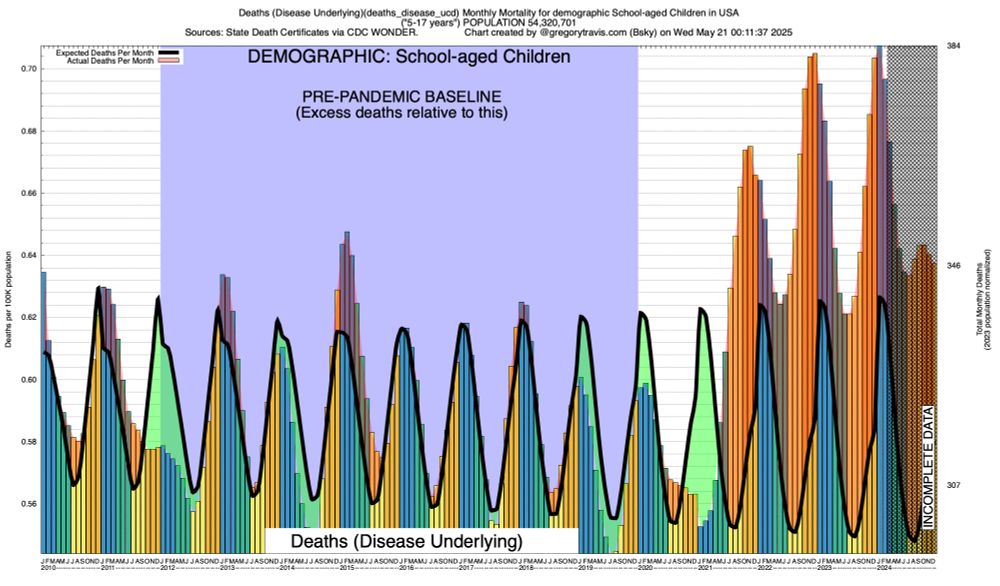
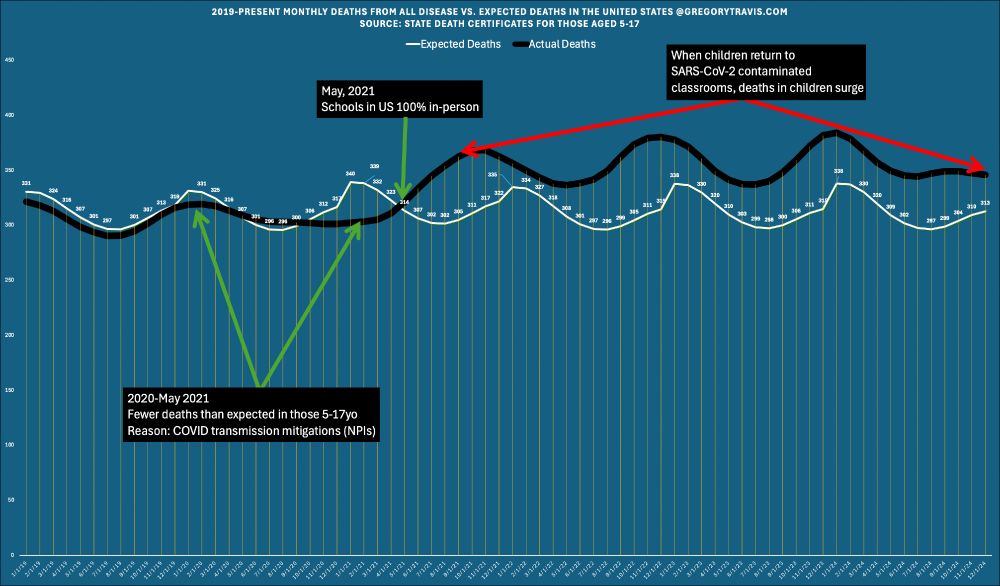
Excess deaths from disease in school-aged children have been elevated since May of 2022 and show no sign of diminishing
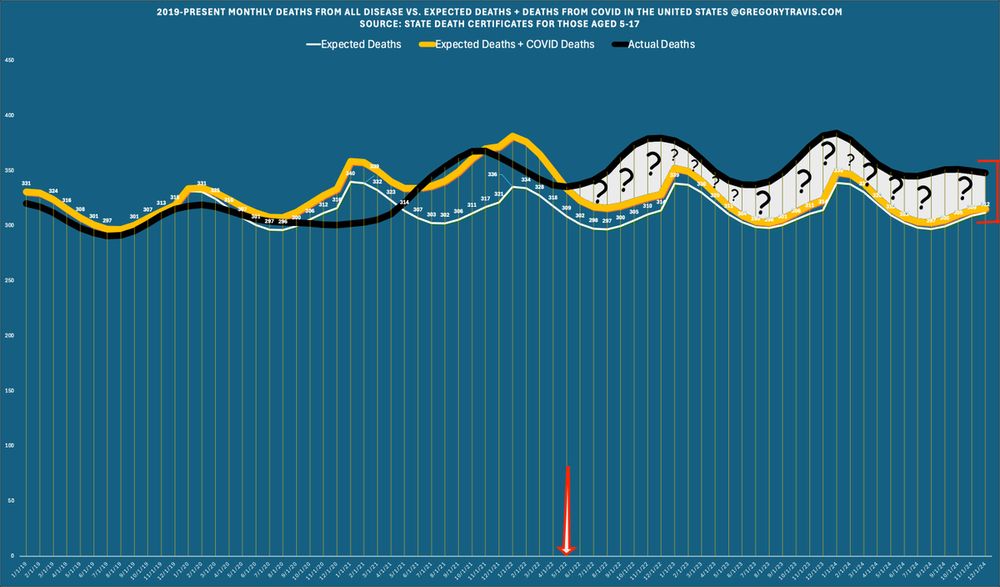
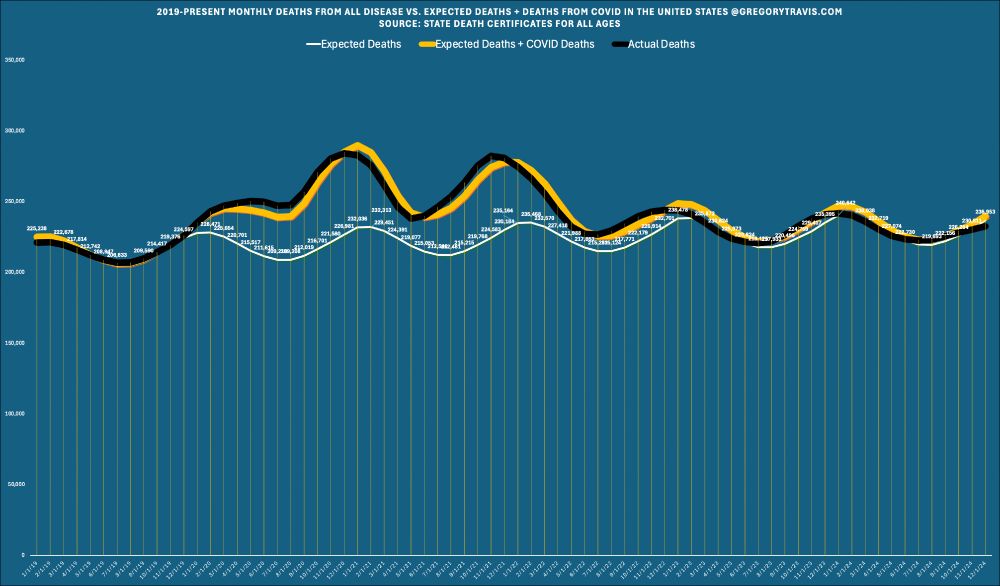
Note that the number of monthly COVID deaths (yellow line) plus expected deaths (white line) does not reach the black line (actual deaths)
Note that the number of monthly COVID deaths (yellow line) plus expected deaths (white line) does not reach the black line (actual deaths)
June 4, 2025 at 2:01 PM
Excess deaths from disease in school-aged children have been elevated since May of 2022 and show no sign of diminishing
Note that the number of monthly COVID deaths (yellow line) plus expected deaths (white line) does not reach the black line (actual deaths)
Note that the number of monthly COVID deaths (yellow line) plus expected deaths (white line) does not reach the black line (actual deaths)
As you can clearly see here, deaths in school-aged children are now a year-round phenomenon
And it's getting worse, not better. Take a look at the data labelled "incomplete data"
It's incomplete because all of the death certificates haven't been counted there
The numbers will go up
And it's getting worse, not better. Take a look at the data labelled "incomplete data"
It's incomplete because all of the death certificates haven't been counted there
The numbers will go up
June 4, 2025 at 1:40 PM
As you can clearly see here, deaths in school-aged children are now a year-round phenomenon
And it's getting worse, not better. Take a look at the data labelled "incomplete data"
It's incomplete because all of the death certificates haven't been counted there
The numbers will go up
And it's getting worse, not better. Take a look at the data labelled "incomplete data"
It's incomplete because all of the death certificates haven't been counted there
The numbers will go up
Monthly deaths from disease in school-aged children (5-17yo)
Prior to the pandemic, deaths from disease in children were extremely seasonal -- peaking around Jan/Feb of every year
COVID changed that pattern dramatically
Prior to the pandemic, deaths from disease in children were extremely seasonal -- peaking around Jan/Feb of every year
COVID changed that pattern dramatically
June 4, 2025 at 1:40 PM
Monthly deaths from disease in school-aged children (5-17yo)
Prior to the pandemic, deaths from disease in children were extremely seasonal -- peaking around Jan/Feb of every year
COVID changed that pattern dramatically
Prior to the pandemic, deaths from disease in children were extremely seasonal -- peaking around Jan/Feb of every year
COVID changed that pattern dramatically
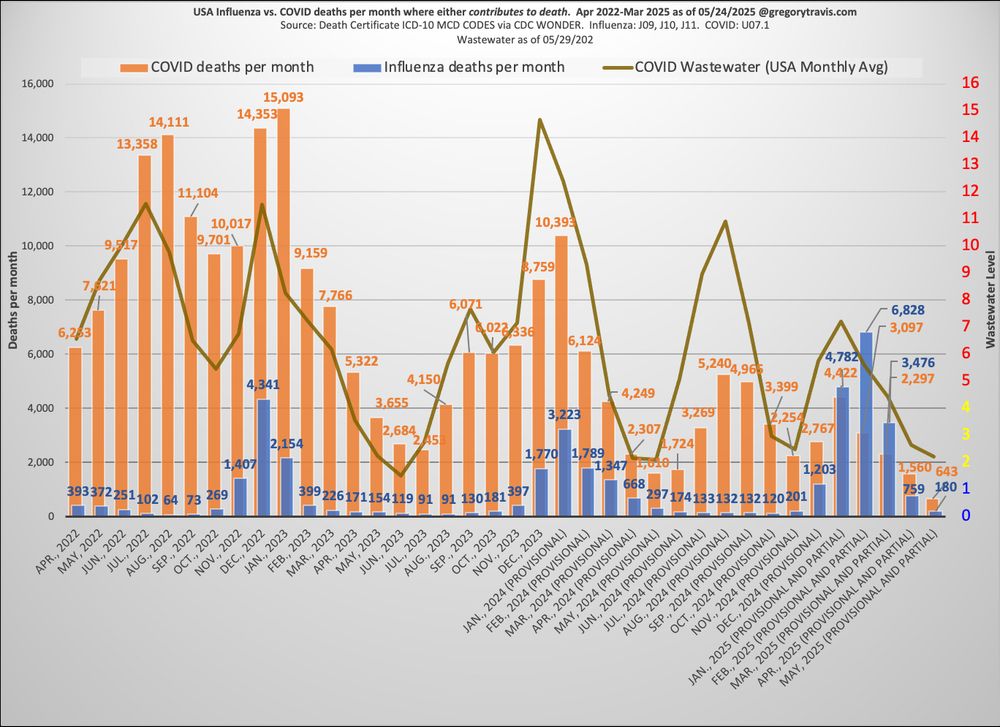
COVID vs. Influenza report
In May 2025:
180 people died from their influenza infections
643 people died from their SARS-CoV-2 (COVID) infections (4x influenza)
In May 2025:
180 people died from their influenza infections
643 people died from their SARS-CoV-2 (COVID) infections (4x influenza)
June 4, 2025 at 12:05 AM
COVID vs. Influenza report
In May 2025:
180 people died from their influenza infections
643 people died from their SARS-CoV-2 (COVID) infections (4x influenza)
In May 2025:
180 people died from their influenza infections
643 people died from their SARS-CoV-2 (COVID) infections (4x influenza)
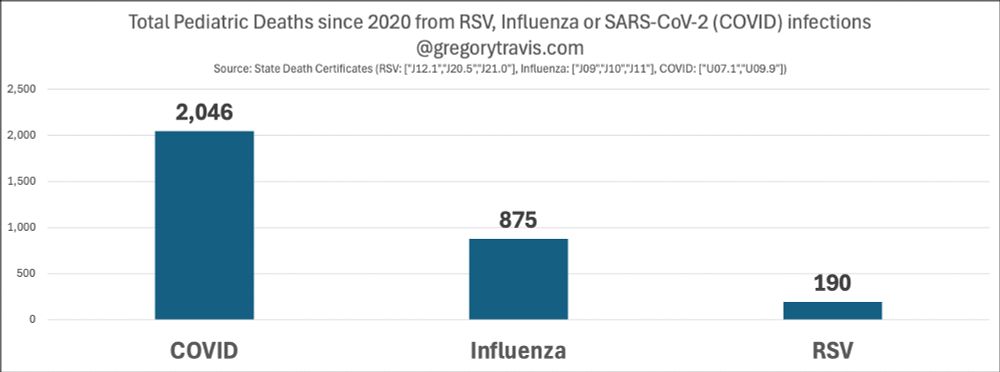
Given HHS has decided to stop recommending SARS-CoV-2 vaccinations in children but continue recommending Influenza vaccinations...
...I submit:
Total deaths due to three infectious pathogens in children, 2020-present:
COVID: 2,046
Influenza: 875
RSV: 190
...I submit:
Total deaths due to three infectious pathogens in children, 2020-present:
COVID: 2,046
Influenza: 875
RSV: 190
May 29, 2025 at 4:16 PM
Given HHS has decided to stop recommending SARS-CoV-2 vaccinations in children but continue recommending Influenza vaccinations...
...I submit:
Total deaths due to three infectious pathogens in children, 2020-present:
COVID: 2,046
Influenza: 875
RSV: 190
...I submit:
Total deaths due to three infectious pathogens in children, 2020-present:
COVID: 2,046
Influenza: 875
RSV: 190
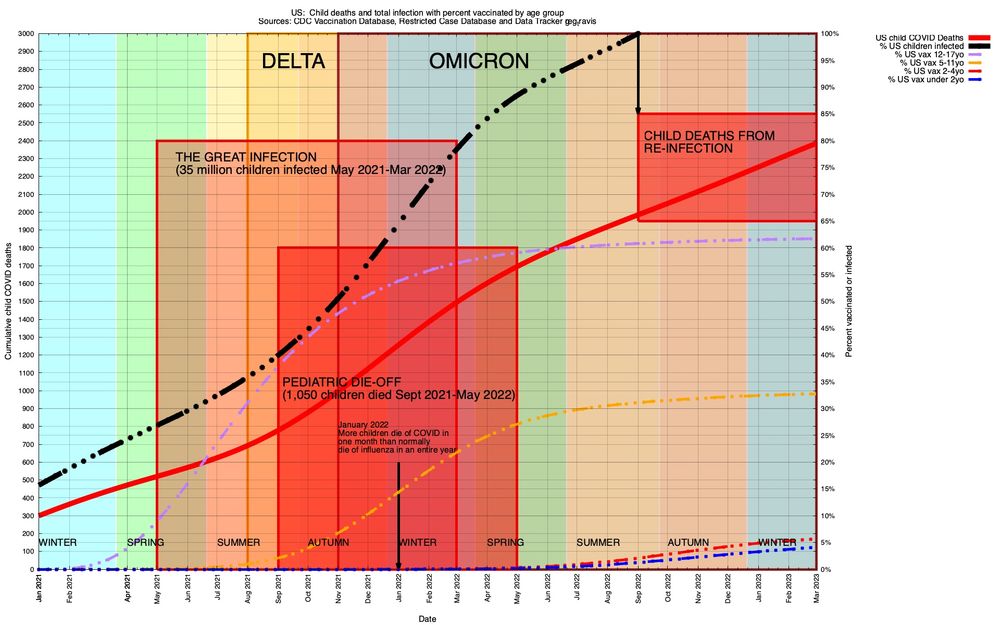
The maximum vaccination rate is given on this chart:
For 12-17yo, 63% of the population received at least one initial COVID vaccine
For those 5-11: 34%
For those 2-4: 5.5%
For those 0-1: 4%
And that was as of two years ago. Virtually no US child has had a vaccination within the last year
For 12-17yo, 63% of the population received at least one initial COVID vaccine
For those 5-11: 34%
For those 2-4: 5.5%
For those 0-1: 4%
And that was as of two years ago. Virtually no US child has had a vaccination within the last year

May 28, 2025 at 7:53 PM
The maximum vaccination rate is given on this chart:
For 12-17yo, 63% of the population received at least one initial COVID vaccine
For those 5-11: 34%
For those 2-4: 5.5%
For those 0-1: 4%
And that was as of two years ago. Virtually no US child has had a vaccination within the last year
For 12-17yo, 63% of the population received at least one initial COVID vaccine
For those 5-11: 34%
For those 2-4: 5.5%
For those 0-1: 4%
And that was as of two years ago. Virtually no US child has had a vaccination within the last year
Pediatric SARS-CoV-2 vaccination rates in the USA are virtually nonexistent
At this point it's safe to say that while most children have been infected with SARS-CoV-2 multiple times, most children are also not vaccinated against the SARS-CoV-2 virus
At this point it's safe to say that while most children have been infected with SARS-CoV-2 multiple times, most children are also not vaccinated against the SARS-CoV-2 virus
May 28, 2025 at 6:03 PM
Pediatric SARS-CoV-2 vaccination rates in the USA are virtually nonexistent
At this point it's safe to say that while most children have been infected with SARS-CoV-2 multiple times, most children are also not vaccinated against the SARS-CoV-2 virus
At this point it's safe to say that while most children have been infected with SARS-CoV-2 multiple times, most children are also not vaccinated against the SARS-CoV-2 virus
Viral infection are a significant cause of chronic heart disease as well as acute events such as stroke or cardiac arrest
We see this in the data. Pediatric >cardiovascular mortality< for instance corresponds nicely with periods of high viral infection in children
We see this in the data. Pediatric >cardiovascular mortality< for instance corresponds nicely with periods of high viral infection in children
May 28, 2025 at 5:59 PM
Viral infection are a significant cause of chronic heart disease as well as acute events such as stroke or cardiac arrest
We see this in the data. Pediatric >cardiovascular mortality< for instance corresponds nicely with periods of high viral infection in children
We see this in the data. Pediatric >cardiovascular mortality< for instance corresponds nicely with periods of high viral infection in children
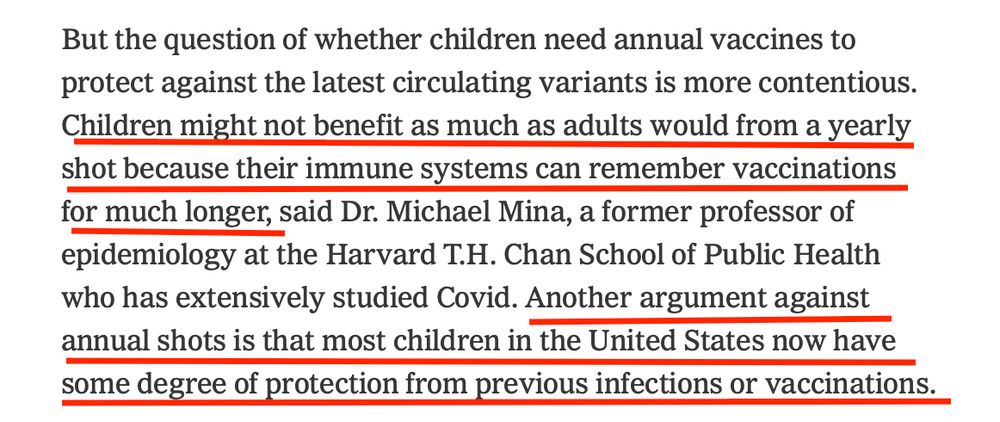
Absolutely incredible
The arguments in favor of NOT vaccinating children against SARS-CoV-2 are:
1. Children have long immune memories. So no more annual flu vaccine for kids?
2. Children are repeatedly & serially infected with the SARS-CoV-2 virus. Each infection is actually a vaccination
The arguments in favor of NOT vaccinating children against SARS-CoV-2 are:
1. Children have long immune memories. So no more annual flu vaccine for kids?
2. Children are repeatedly & serially infected with the SARS-CoV-2 virus. Each infection is actually a vaccination
May 28, 2025 at 4:04 AM
Absolutely incredible
The arguments in favor of NOT vaccinating children against SARS-CoV-2 are:
1. Children have long immune memories. So no more annual flu vaccine for kids?
2. Children are repeatedly & serially infected with the SARS-CoV-2 virus. Each infection is actually a vaccination
The arguments in favor of NOT vaccinating children against SARS-CoV-2 are:
1. Children have long immune memories. So no more annual flu vaccine for kids?
2. Children are repeatedly & serially infected with the SARS-CoV-2 virus. Each infection is actually a vaccination
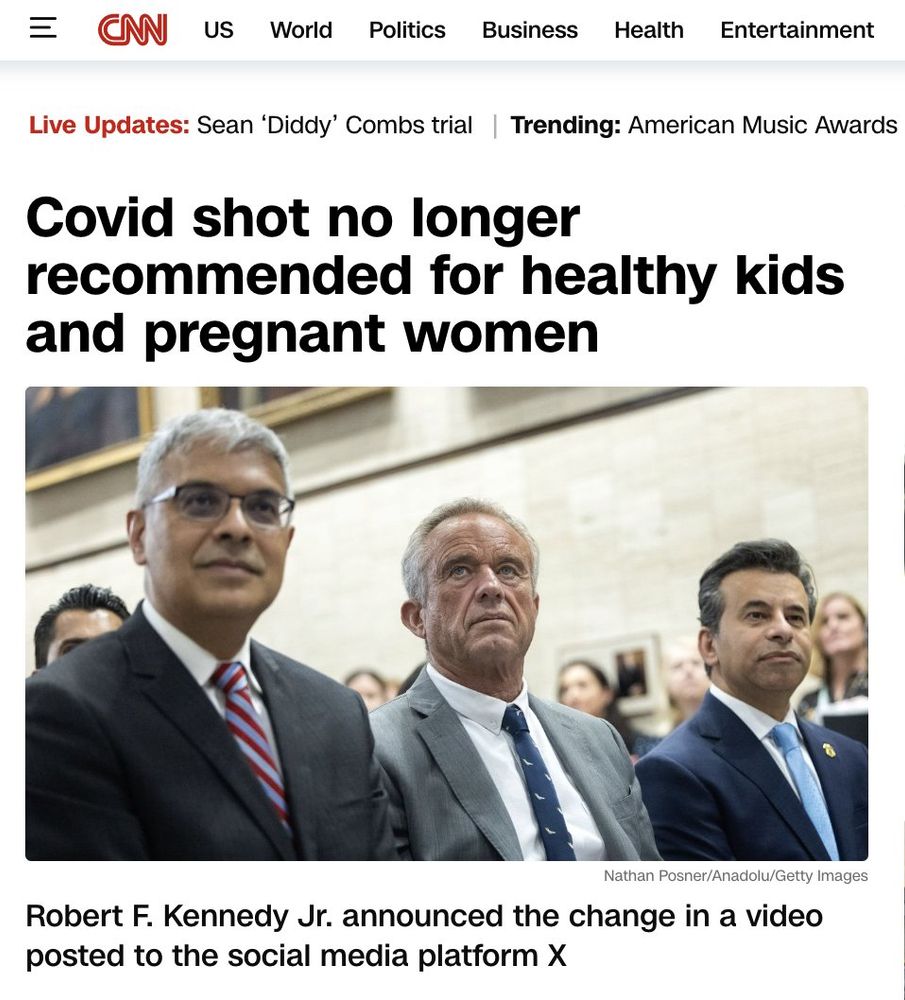
"Covid shot no longer recommended for healthy kids and pregnant women"
1. SARS-CoV-2 continues to be the leading cause of death from infectious disease in healthy kids
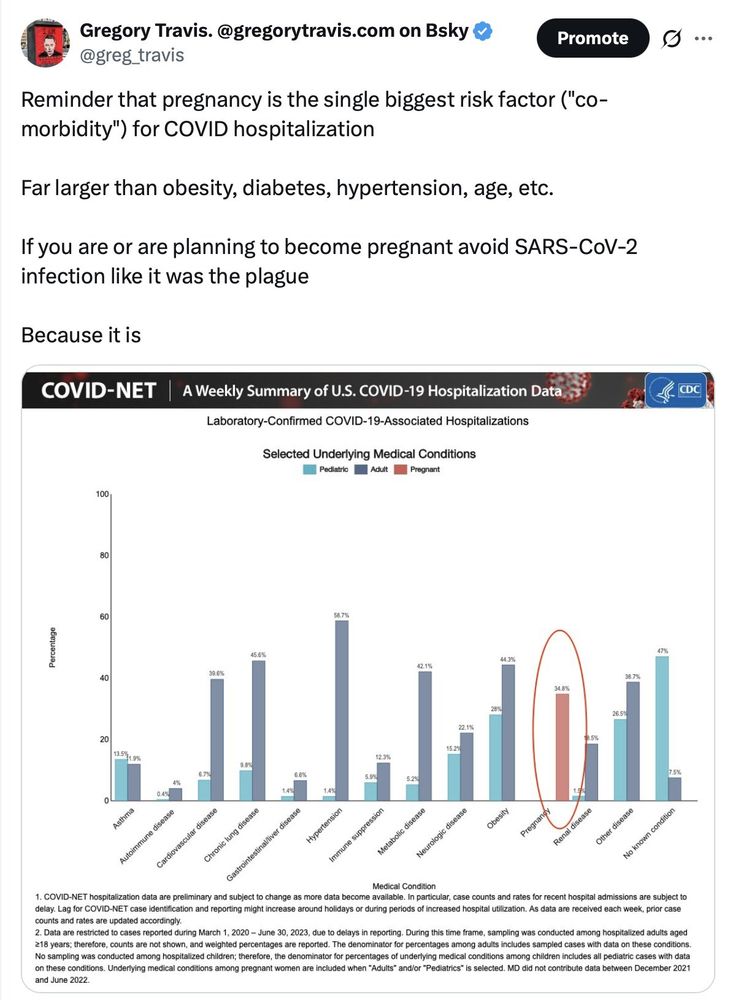
2. Pregnant women by definition have impaired immune function and are one of the highest-risk groups for SARS-CoV-2 infection
1. SARS-CoV-2 continues to be the leading cause of death from infectious disease in healthy kids
2. Pregnant women by definition have impaired immune function and are one of the highest-risk groups for SARS-CoV-2 infection
May 27, 2025 at 6:34 PM
"Covid shot no longer recommended for healthy kids and pregnant women"
1. SARS-CoV-2 continues to be the leading cause of death from infectious disease in healthy kids
2. Pregnant women by definition have impaired immune function and are one of the highest-risk groups for SARS-CoV-2 infection
1. SARS-CoV-2 continues to be the leading cause of death from infectious disease in healthy kids
2. Pregnant women by definition have impaired immune function and are one of the highest-risk groups for SARS-CoV-2 infection
"Covid [vaccination] no longer recommended for healthy kids and pregnant women"
1. SARS-CoV-2 is the leading cause of death from infectious disease in children
2. Pregnant women have impaired immune function and are one of the highest-risk groups for SARS-CoV-2 infection
This is just evil
1. SARS-CoV-2 is the leading cause of death from infectious disease in children
2. Pregnant women have impaired immune function and are one of the highest-risk groups for SARS-CoV-2 infection
This is just evil
May 27, 2025 at 6:32 PM
"Covid [vaccination] no longer recommended for healthy kids and pregnant women"
1. SARS-CoV-2 is the leading cause of death from infectious disease in children
2. Pregnant women have impaired immune function and are one of the highest-risk groups for SARS-CoV-2 infection
This is just evil
1. SARS-CoV-2 is the leading cause of death from infectious disease in children
2. Pregnant women have impaired immune function and are one of the highest-risk groups for SARS-CoV-2 infection
This is just evil
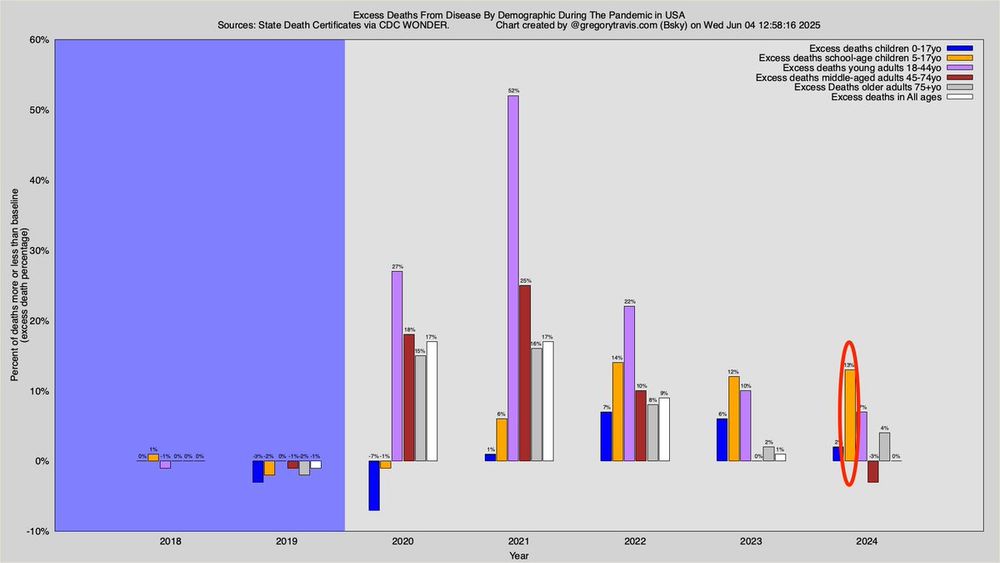
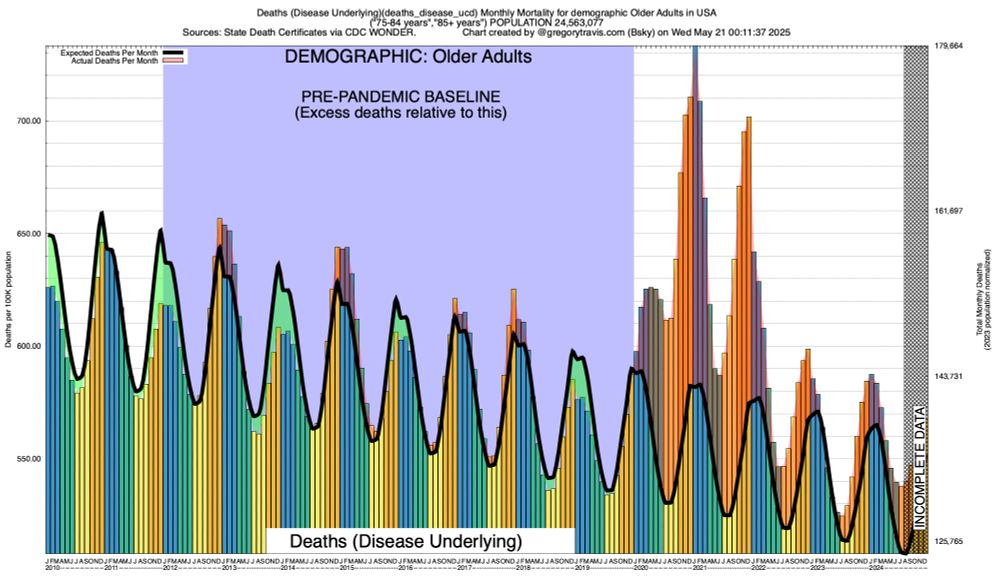
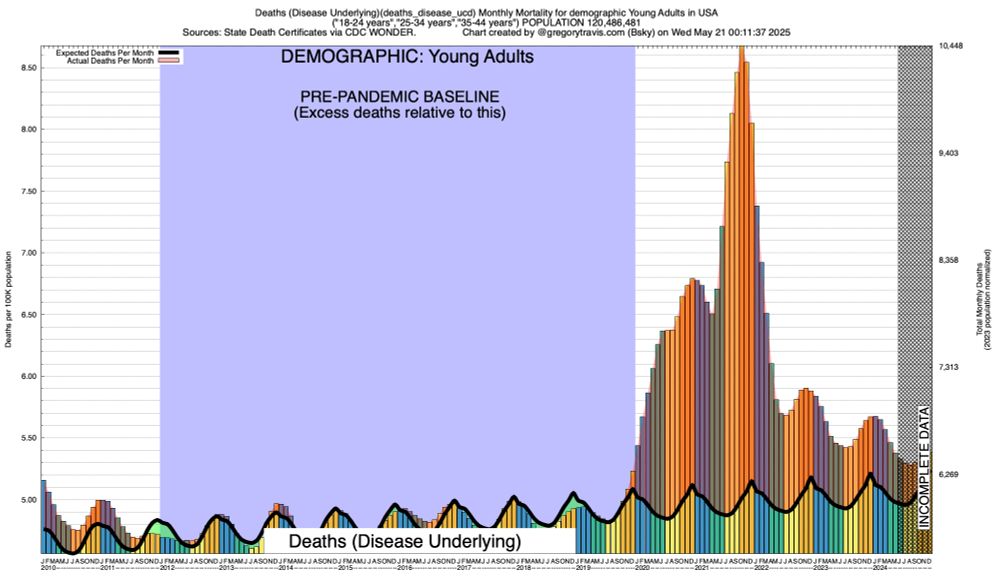
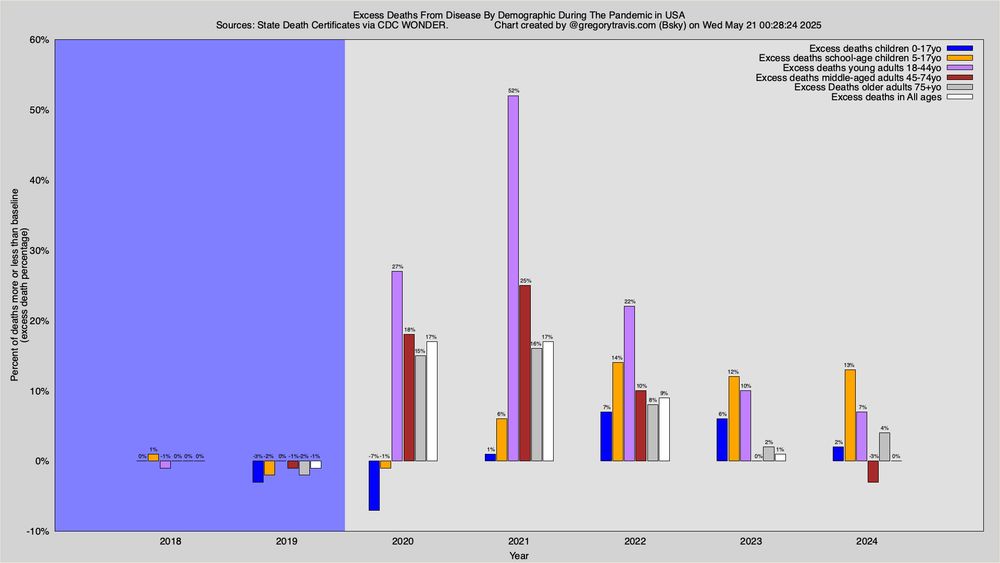
Yeah, except we don't see that happening in any age bracket other than those aged 45-74 years old
For all other ages, particularly the young, mortality continues at a very high rate
For all other ages, particularly the young, mortality continues at a very high rate
May 27, 2025 at 2:58 PM
Yeah, except we don't see that happening in any age bracket other than those aged 45-74 years old
For all other ages, particularly the young, mortality continues at a very high rate
For all other ages, particularly the young, mortality continues at a very high rate
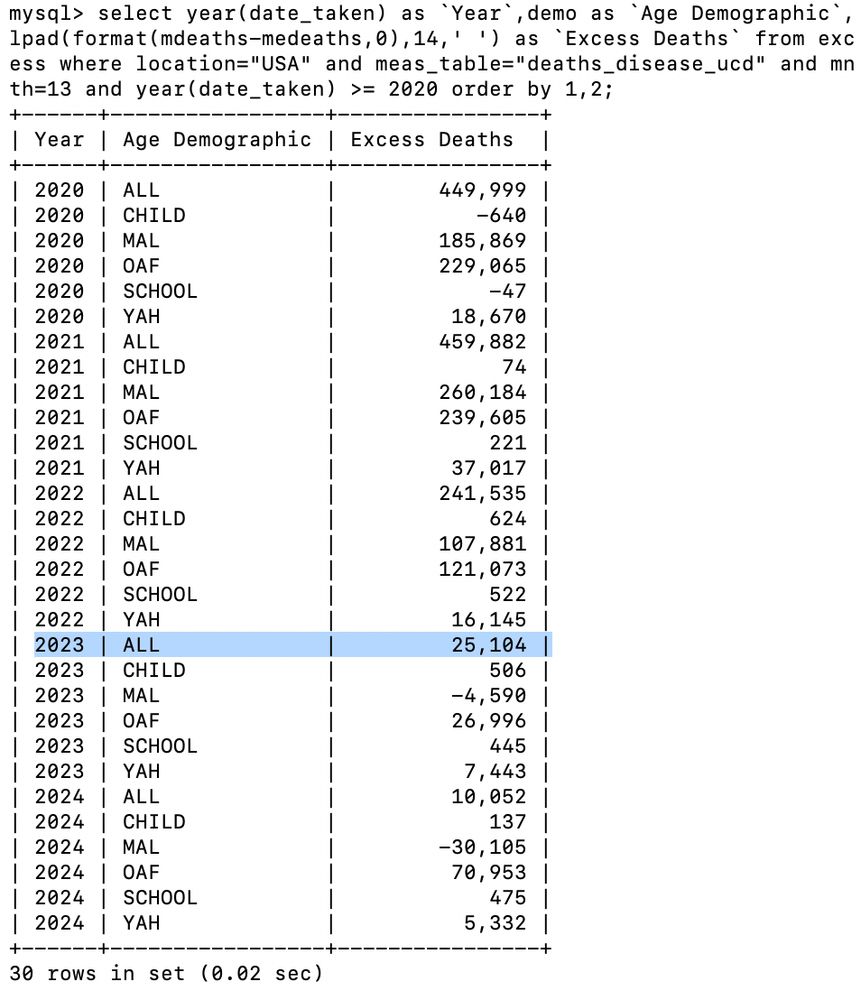
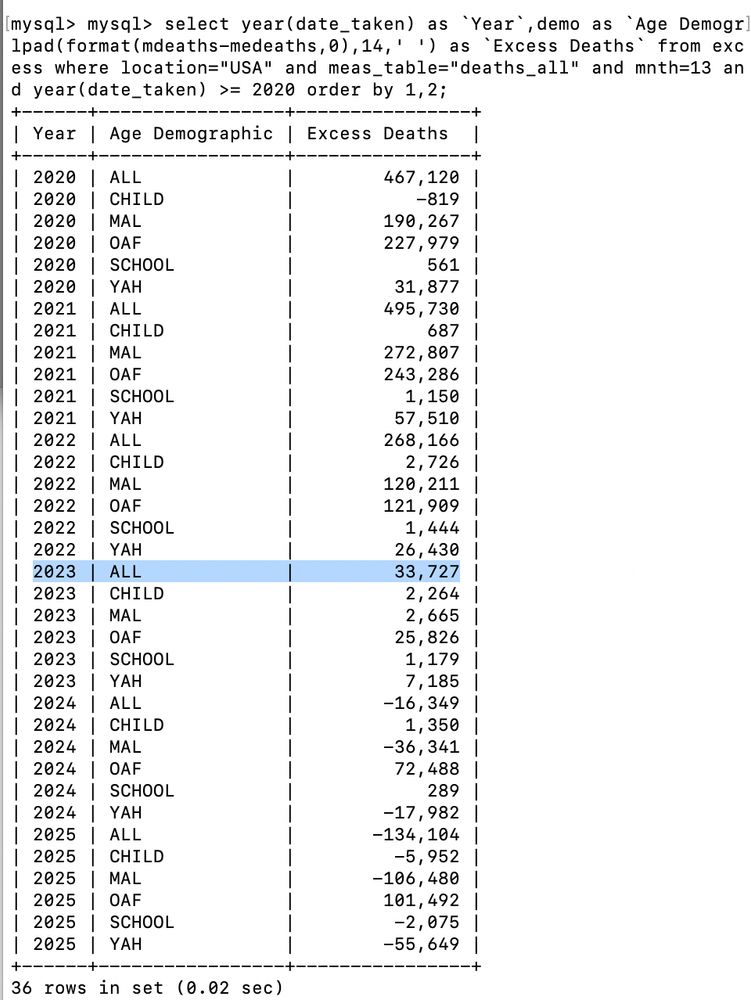
Excess Deaths vs. COVID infections 2020-present
I calculate 25,104 excess deaths from disease and 33,727 a-cause excess deaths for 2023
705K excess deaths in 2023 is simply not credible at any level
I calculate 25,104 excess deaths from disease and 33,727 a-cause excess deaths for 2023
705K excess deaths in 2023 is simply not credible at any level
May 27, 2025 at 2:49 PM
Excess Deaths vs. COVID infections 2020-present
I calculate 25,104 excess deaths from disease and 33,727 a-cause excess deaths for 2023
705K excess deaths in 2023 is simply not credible at any level
I calculate 25,104 excess deaths from disease and 33,727 a-cause excess deaths for 2023
705K excess deaths in 2023 is simply not credible at any level
Yes, sadly the pandemic is ongoing for one class of people -- those aged 5-17
It's stopped for us older adults
But for children it keeps on going, relentlessly
When are we going to talk about this?
I'm guessing it's an Inconvenient Truth
So, never?
It's stopped for us older adults
But for children it keeps on going, relentlessly
When are we going to talk about this?
I'm guessing it's an Inconvenient Truth
So, never?
May 26, 2025 at 1:24 PM
Yes, sadly the pandemic is ongoing for one class of people -- those aged 5-17
It's stopped for us older adults
But for children it keeps on going, relentlessly
When are we going to talk about this?
I'm guessing it's an Inconvenient Truth
So, never?
It's stopped for us older adults
But for children it keeps on going, relentlessly
When are we going to talk about this?
I'm guessing it's an Inconvenient Truth
So, never?
That's the same chart as I did for all ages except it's now restricted to the 5-17yo age group
Why does that chart look so different than the all-ages one?
More important, why does it look like the pandemic did not end in February 2024 for children?
Here's why
Why does that chart look so different than the all-ages one?
More important, why does it look like the pandemic did not end in February 2024 for children?
Here's why
May 26, 2025 at 1:24 PM
That's the same chart as I did for all ages except it's now restricted to the 5-17yo age group
Why does that chart look so different than the all-ages one?
More important, why does it look like the pandemic did not end in February 2024 for children?
Here's why
Why does that chart look so different than the all-ages one?
More important, why does it look like the pandemic did not end in February 2024 for children?
Here's why
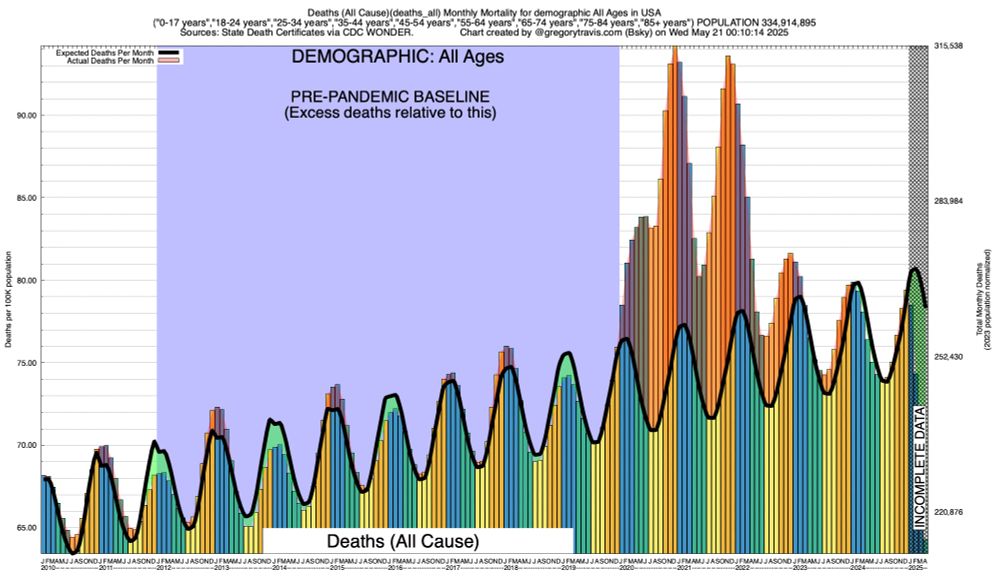
Those charts were for deaths in ALL ages
Since most people wait until they are old to die, the statistics in that chart are flooded by the ordinary, expected, deaths of old people and old people die, as I said, all the time
So take a look at this chart
Since most people wait until they are old to die, the statistics in that chart are flooded by the ordinary, expected, deaths of old people and old people die, as I said, all the time
So take a look at this chart

May 26, 2025 at 1:24 PM
Those charts were for deaths in ALL ages
Since most people wait until they are old to die, the statistics in that chart are flooded by the ordinary, expected, deaths of old people and old people die, as I said, all the time
So take a look at this chart
Since most people wait until they are old to die, the statistics in that chart are flooded by the ordinary, expected, deaths of old people and old people die, as I said, all the time
So take a look at this chart
Note that the black and white lines converge again in February of 2024
Does that mean the SARS-CoV-2 ("COVID") pandemic only lasted from 2020-2024?
No. And I am going to tell you why...
Does that mean the SARS-CoV-2 ("COVID") pandemic only lasted from 2020-2024?
No. And I am going to tell you why...

May 26, 2025 at 1:24 PM
Note that the black and white lines converge again in February of 2024
Does that mean the SARS-CoV-2 ("COVID") pandemic only lasted from 2020-2024?
No. And I am going to tell you why...
Does that mean the SARS-CoV-2 ("COVID") pandemic only lasted from 2020-2024?
No. And I am going to tell you why...
Until January 2020, actual deaths were identical to what we expected
But then the lines began to diverge
The gap between the lines is "excess" death if the black line is above the white line
It's NEGATIVE excess deaths if the black line is below the white line
So simple even I understand it
But then the lines began to diverge
The gap between the lines is "excess" death if the black line is above the white line
It's NEGATIVE excess deaths if the black line is below the white line
So simple even I understand it

May 26, 2025 at 1:24 PM
Until January 2020, actual deaths were identical to what we expected
But then the lines began to diverge
The gap between the lines is "excess" death if the black line is above the white line
It's NEGATIVE excess deaths if the black line is below the white line
So simple even I understand it
But then the lines began to diverge
The gap between the lines is "excess" death if the black line is above the white line
It's NEGATIVE excess deaths if the black line is below the white line
So simple even I understand it
Here's an example of excess death analysis
The white line represents the number of deaths per month that we EXPECT, given history
The black line represents the ACTUAL number of deaths each month
Expected vs. Actual
Yes, it's as simple as that
The white line represents the number of deaths per month that we EXPECT, given history
The black line represents the ACTUAL number of deaths each month
Expected vs. Actual
Yes, it's as simple as that
May 26, 2025 at 1:24 PM
Here's an example of excess death analysis
The white line represents the number of deaths per month that we EXPECT, given history
The black line represents the ACTUAL number of deaths each month
Expected vs. Actual
Yes, it's as simple as that
The white line represents the number of deaths per month that we EXPECT, given history
The black line represents the ACTUAL number of deaths each month
Expected vs. Actual
Yes, it's as simple as that
Weekly COVID vs. Influenza report
SARS-CoV-2 infection has again pulled away from flu as the leading cause of significant ongoing mortality
In May of 2025:
732 died of the flu
1,475 died of COVID (two times (2x) the rate of flu)
April of 2025:
COVID has killed four times (4x) more than flu
SARS-CoV-2 infection has again pulled away from flu as the leading cause of significant ongoing mortality
In May of 2025:
732 died of the flu
1,475 died of COVID (two times (2x) the rate of flu)
April of 2025:
COVID has killed four times (4x) more than flu

May 24, 2025 at 3:03 PM
Weekly COVID vs. Influenza report
SARS-CoV-2 infection has again pulled away from flu as the leading cause of significant ongoing mortality
In May of 2025:
732 died of the flu
1,475 died of COVID (two times (2x) the rate of flu)
April of 2025:
COVID has killed four times (4x) more than flu
SARS-CoV-2 infection has again pulled away from flu as the leading cause of significant ongoing mortality
In May of 2025:
732 died of the flu
1,475 died of COVID (two times (2x) the rate of flu)
April of 2025:
COVID has killed four times (4x) more than flu
What people are missing here is not that college students cheat on exams (they always have)
But that it's apparently trivial to write examinations that AI can't pass
Think about that
But that it's apparently trivial to write examinations that AI can't pass
Think about that

May 14, 2025 at 12:12 PM
What people are missing here is not that college students cheat on exams (they always have)
But that it's apparently trivial to write examinations that AI can't pass
Think about that
But that it's apparently trivial to write examinations that AI can't pass
Think about that
Weekly influenza vs. COVID report
In April 2025 (last month), COVID killed more than twice as many people as influenza
For three months flu bested COVID but, like the turtle and the hare, COVID wins in the end
This ends the flu's brief but attention-grabbing bid to outdo COVID
Image
In April 2025 (last month), COVID killed more than twice as many people as influenza
For three months flu bested COVID but, like the turtle and the hare, COVID wins in the end
This ends the flu's brief but attention-grabbing bid to outdo COVID
Image
May 13, 2025 at 6:50 PM
Weekly influenza vs. COVID report
In April 2025 (last month), COVID killed more than twice as many people as influenza
For three months flu bested COVID but, like the turtle and the hare, COVID wins in the end
This ends the flu's brief but attention-grabbing bid to outdo COVID
Image
In April 2025 (last month), COVID killed more than twice as many people as influenza
For three months flu bested COVID but, like the turtle and the hare, COVID wins in the end
This ends the flu's brief but attention-grabbing bid to outdo COVID
Image
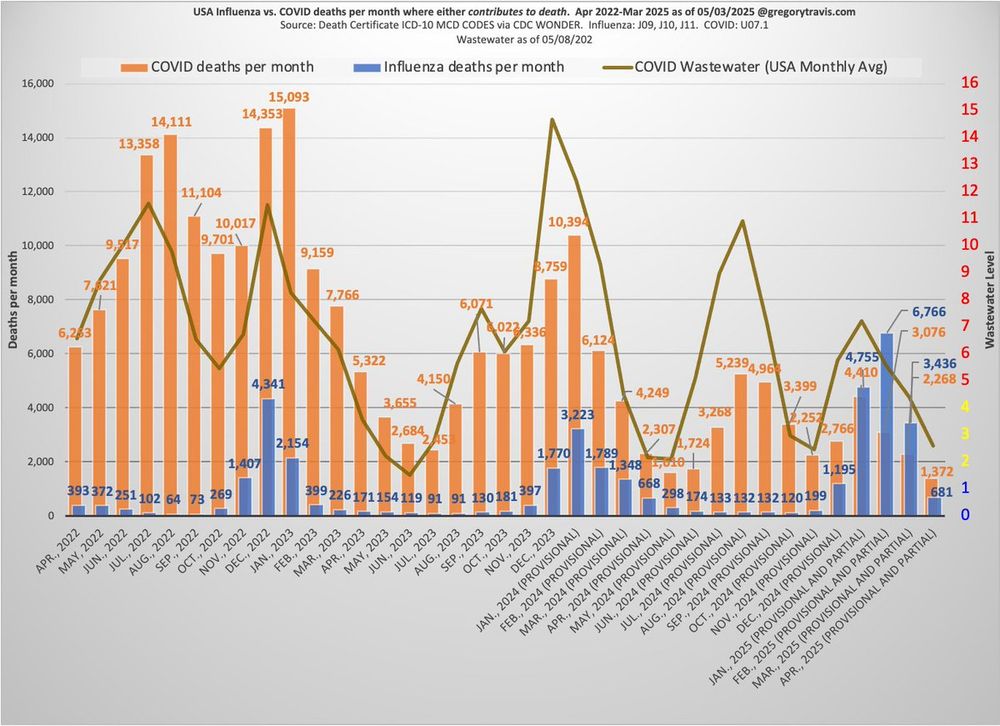
Weekly COVID vs. Influenza report
Jan/Feb/Mar each saw more deaths from influenza than COVID -- a first
However, April gets us back to an old familiar pattern with COVID once again causing at least twice as many deaths per month as influenza (1,134 COVID deaths/584 Flu deaths)
Jan/Feb/Mar each saw more deaths from influenza than COVID -- a first
However, April gets us back to an old familiar pattern with COVID once again causing at least twice as many deaths per month as influenza (1,134 COVID deaths/584 Flu deaths)

May 7, 2025 at 10:59 AM
Weekly COVID vs. Influenza report
Jan/Feb/Mar each saw more deaths from influenza than COVID -- a first
However, April gets us back to an old familiar pattern with COVID once again causing at least twice as many deaths per month as influenza (1,134 COVID deaths/584 Flu deaths)
Jan/Feb/Mar each saw more deaths from influenza than COVID -- a first
However, April gets us back to an old familiar pattern with COVID once again causing at least twice as many deaths per month as influenza (1,134 COVID deaths/584 Flu deaths)
Well, ok where are the greatest numerical increases?
Sadly, it's in cancer
Pediatric cancer had been in a free-fall prior to the pandemic
Now it's going up
I don't know what's driving this other than the obvious: viral infection
Sadly, it's in cancer
Pediatric cancer had been in a free-fall prior to the pandemic
Now it's going up
I don't know what's driving this other than the obvious: viral infection


April 30, 2025 at 10:24 PM
Well, ok where are the greatest numerical increases?
Sadly, it's in cancer
Pediatric cancer had been in a free-fall prior to the pandemic
Now it's going up
I don't know what's driving this other than the obvious: viral infection
Sadly, it's in cancer
Pediatric cancer had been in a free-fall prior to the pandemic
Now it's going up
I don't know what's driving this other than the obvious: viral infection