


Eric Fauman (he/him)
@ericfauman.bsky.social
GWAS whisperer.
It's usually the closest gene.
Executive Director, Integrative Biology, Internal Medicine Research Unit. Pfizer R&D. All views my own.
Also cats.
It's usually the closest gene.
Executive Director, Integrative Biology, Internal Medicine Research Unit. Pfizer R&D. All views my own.
Also cats.
If you didn't get your certificate were you really even there?

October 19, 2025 at 5:58 PM
If you didn't get your certificate were you really even there?
It's a little odd. I am plotting the log10 of the -log10(pvalue) on the x axis so in this plot the null signal drops off much faster than what we observe in the @gwascatalog.bsky.social
I'm curious if anyone has a hypothesis why the lead SNP p-values would have this distribution.
I'm curious if anyone has a hypothesis why the lead SNP p-values would have this distribution.

September 28, 2025 at 1:50 PM
It's a little odd. I am plotting the log10 of the -log10(pvalue) on the x axis so in this plot the null signal drops off much faster than what we observe in the @gwascatalog.bsky.social
I'm curious if anyone has a hypothesis why the lead SNP p-values would have this distribution.
I'm curious if anyone has a hypothesis why the lead SNP p-values would have this distribution.
Quick quiz. This is a plot of how often each p-value appears in this @gwascatalog.bsky.social. Actually I binned the -log10(p) values to their integer values (e.g., 8-9, 9-10, etc).
I'm highlighting 3 outliers here, in orange.
What are these p-values and why do they diverge so much?
I'm highlighting 3 outliers here, in orange.
What are these p-values and why do they diverge so much?

September 27, 2025 at 11:41 PM
Quick quiz. This is a plot of how often each p-value appears in this @gwascatalog.bsky.social. Actually I binned the -log10(p) values to their integer values (e.g., 8-9, 9-10, etc).
I'm highlighting 3 outliers here, in orange.
What are these p-values and why do they diverge so much?
I'm highlighting 3 outliers here, in orange.
What are these p-values and why do they diverge so much?
Getting ready for ASHG25 here in Boston! Who's coming to town?
As you know, I am fascinated by extreme GWAS p-values.
Will we see anything beyond the current record holder, 10^-28538, for eye color.
Interestingly, the p-values for all lead SNPs in the @gwascatalog.bsky.social follow a power law
As you know, I am fascinated by extreme GWAS p-values.
Will we see anything beyond the current record holder, 10^-28538, for eye color.
Interestingly, the p-values for all lead SNPs in the @gwascatalog.bsky.social follow a power law
September 27, 2025 at 11:38 PM
Getting ready for ASHG25 here in Boston! Who's coming to town?
As you know, I am fascinated by extreme GWAS p-values.
Will we see anything beyond the current record holder, 10^-28538, for eye color.
Interestingly, the p-values for all lead SNPs in the @gwascatalog.bsky.social follow a power law
As you know, I am fascinated by extreme GWAS p-values.
Will we see anything beyond the current record holder, 10^-28538, for eye color.
Interestingly, the p-values for all lead SNPs in the @gwascatalog.bsky.social follow a power law
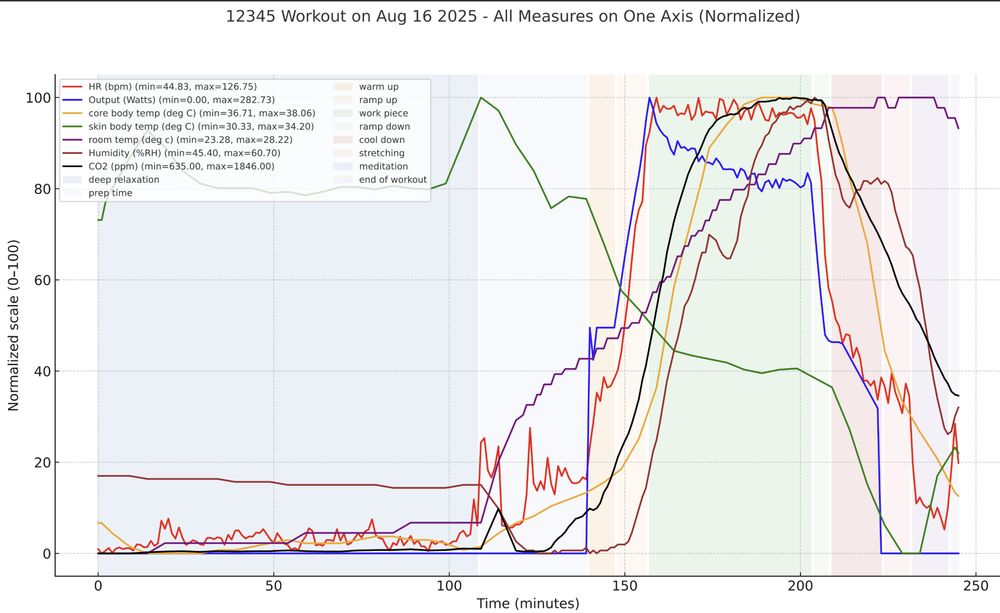
For fun I'm also tracking the room temperature, humidity and CO2 which all increase during the workout, as expected.
All the analysis, charting and graphs were done by GPT5 operating on a google sheet where I collected the minute by minute stats.
All the analysis, charting and graphs were done by GPT5 operating on a google sheet where I collected the minute by minute stats.
August 16, 2025 at 10:50 PM
For fun I'm also tracking the room temperature, humidity and CO2 which all increase during the workout, as expected.
All the analysis, charting and graphs were done by GPT5 operating on a google sheet where I collected the minute by minute stats.
All the analysis, charting and graphs were done by GPT5 operating on a google sheet where I collected the minute by minute stats.
GPT4o pointed me to a device that measures core and skin body temperature. In gold you can see my core body temp continues to rise even after I reach my max heart rate (red), thus requiring further decreases in the work output (blue). Skin temperature drops during the workout, thanks to fans + sweat
August 16, 2025 at 10:49 PM
GPT4o pointed me to a device that measures core and skin body temperature. In gold you can see my core body temp continues to rise even after I reach my max heart rate (red), thus requiring further decreases in the work output (blue). Skin temperature drops during the workout, thanks to fans + sweat
This graph plots a study I did on myself which involves trying to maintain a heart rate of exactly 123 bpm for 45 minutes. Doing so requires adjusting the work output. In this plot the red line is my heart rate while the blue line is the work output, which you can see decreases over time.
August 16, 2025 at 10:46 PM
This graph plots a study I did on myself which involves trying to maintain a heart rate of exactly 123 bpm for 45 minutes. Doing so requires adjusting the work output. In this plot the red line is my heart rate while the blue line is the work output, which you can see decreases over time.
Specifically, the phenomenon is called cardiovascular drift and it is a consequence of the body having to do the mechanical work and then also additional work to dissipate the heat generated by the effort, especially the vasodilation to direct internal body heat to the surface.
August 16, 2025 at 10:44 PM
Specifically, the phenomenon is called cardiovascular drift and it is a consequence of the body having to do the mechanical work and then also additional work to dissipate the heat generated by the effort, especially the vasodilation to direct internal body heat to the surface.
Years ago I asked on Twitter why my heart rate would continue to climb even after I fixed the speed and incline on my treadmill. At the time, no one on Twitter could give me a satisfactory answer.
But now GPT4o was able to answer it and suggested approaches to quantify the phenomenon.
But now GPT4o was able to answer it and suggested approaches to quantify the phenomenon.
August 16, 2025 at 10:42 PM
Years ago I asked on Twitter why my heart rate would continue to climb even after I fixed the speed and incline on my treadmill. At the time, no one on Twitter could give me a satisfactory answer.
But now GPT4o was able to answer it and suggested approaches to quantify the phenomenon.
But now GPT4o was able to answer it and suggested approaches to quantify the phenomenon.
Any population geneticist want to weigh in on whether any of this makes sense.
May 25, 2025 at 8:51 PM
Any population geneticist want to weigh in on whether any of this makes sense.
In this model the effective population size reflects some kind of weighted sum of (reduced cross viability with the larger unfused population) and (higher reproductive success with the smaller fusion carriers).
In absolute terms I imagine there was a "bottleneck" of one chr2 fusion carrier.
In absolute terms I imagine there was a "bottleneck" of one chr2 fusion carrier.
May 25, 2025 at 8:42 PM
In this model the effective population size reflects some kind of weighted sum of (reduced cross viability with the larger unfused population) and (higher reproductive success with the smaller fusion carriers).
In absolute terms I imagine there was a "bottleneck" of one chr2 fusion carrier.
In absolute terms I imagine there was a "bottleneck" of one chr2 fusion carrier.
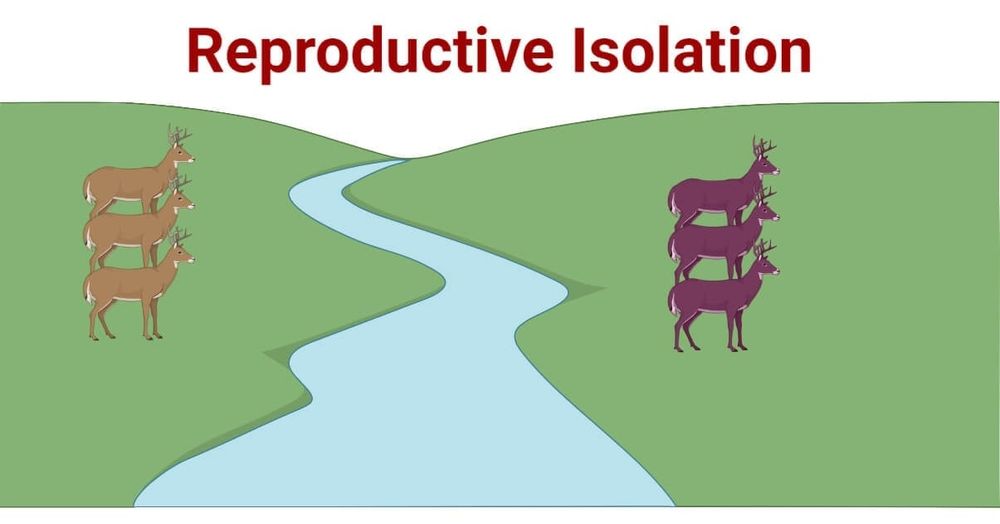
All the non-fusion carriers are still around but we'd expect reduced reproductive success between fusion carriers and non-carriers.
No massive extinction event.
Just a genetic barrier between the original population and the fusion carriers.
No massive extinction event.
Just a genetic barrier between the original population and the fusion carriers.
May 25, 2025 at 8:38 PM
All the non-fusion carriers are still around but we'd expect reduced reproductive success between fusion carriers and non-carriers.
No massive extinction event.
Just a genetic barrier between the original population and the fusion carriers.
No massive extinction event.
Just a genetic barrier between the original population and the fusion carriers.
Let's imagine a child was born 900kya with a chromosome 2 fusion. Chromosomal fusions occur today in 1:1000 live births.
Beating expectations this individual was able to reproduce, nucleating a small cohort of chr2 fusion carriers
molecularcytogenetics.biomedcentral.com/articles/10....
Beating expectations this individual was able to reproduce, nucleating a small cohort of chr2 fusion carriers
molecularcytogenetics.biomedcentral.com/articles/10....
May 25, 2025 at 8:33 PM
Let's imagine a child was born 900kya with a chromosome 2 fusion. Chromosomal fusions occur today in 1:1000 live births.
Beating expectations this individual was able to reproduce, nucleating a small cohort of chr2 fusion carriers
molecularcytogenetics.biomedcentral.com/articles/10....
Beating expectations this individual was able to reproduce, nucleating a small cohort of chr2 fusion carriers
molecularcytogenetics.biomedcentral.com/articles/10....
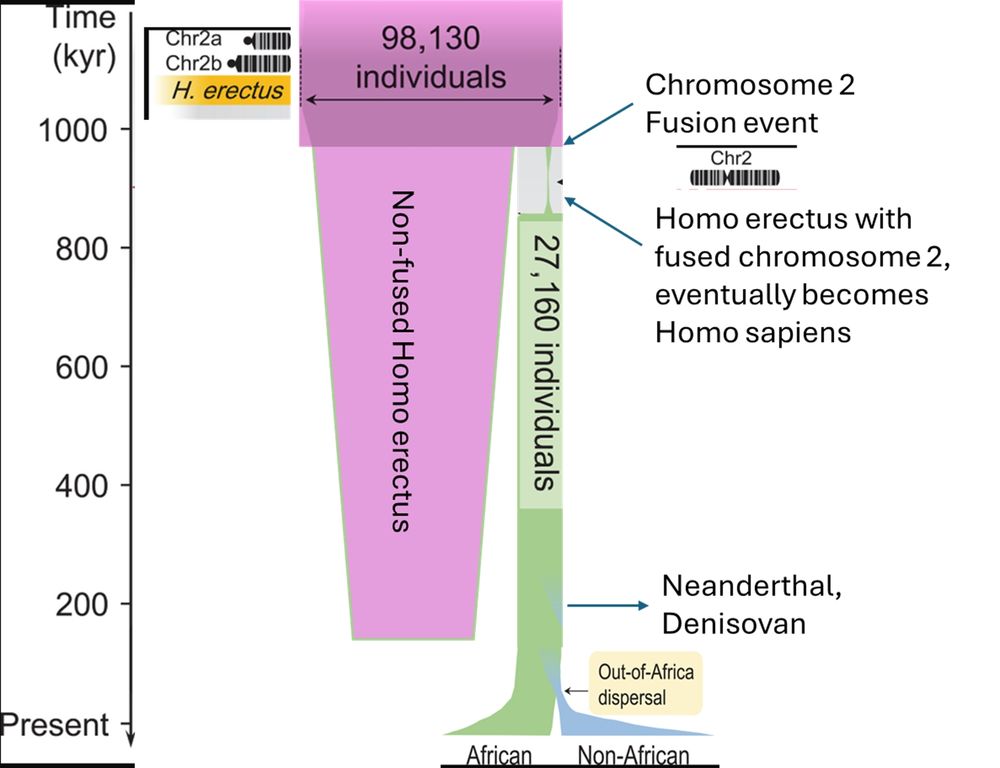
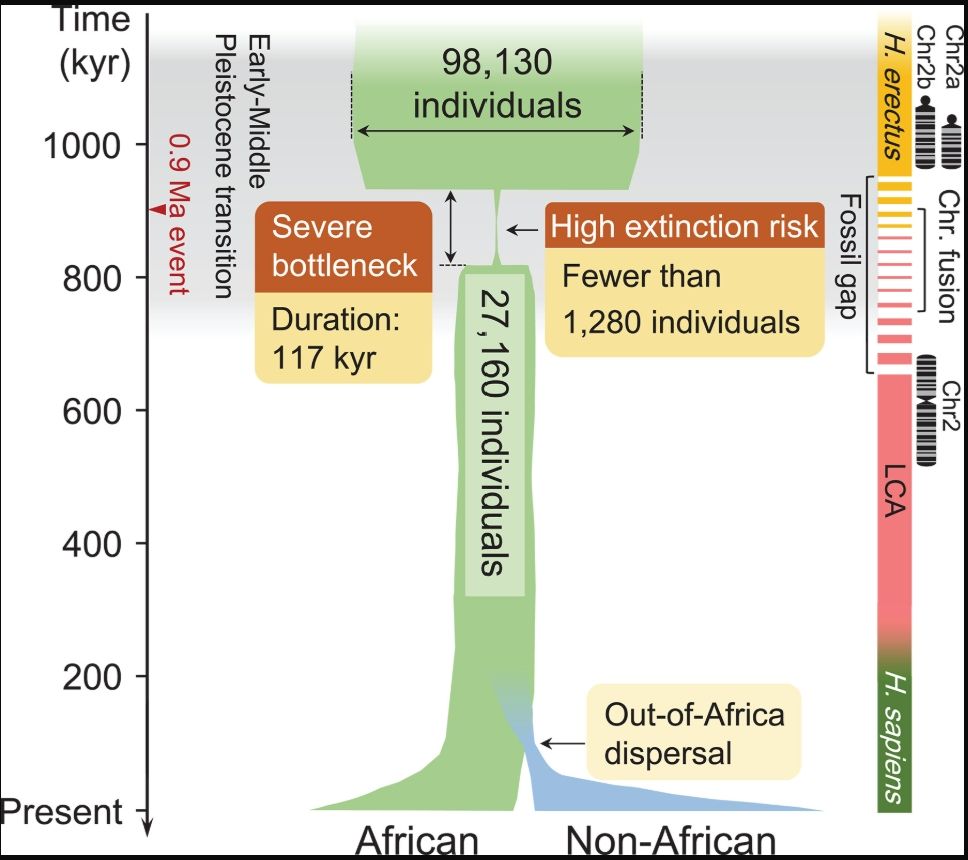
This figure and the coverage of the paper interpret the findings to mean that 99% of the human ancestors alive at the time were wiped out by some cataclysm like major climate change.
See here: www.nature.com/articles/d41...
But what if there was no extinction event, just reproductive isolation
See here: www.nature.com/articles/d41...
But what if there was no extinction event, just reproductive isolation
May 25, 2025 at 8:24 PM
This figure and the coverage of the paper interpret the findings to mean that 99% of the human ancestors alive at the time were wiped out by some cataclysm like major climate change.
See here: www.nature.com/articles/d41...
But what if there was no extinction event, just reproductive isolation
See here: www.nature.com/articles/d41...
But what if there was no extinction event, just reproductive isolation
This paper from late 2023 got a lot of attention in both the scientific and popular press based on the claim that the effective population size of humans was reduced to 1,280 individuals about 900k years ago
www.science.org/doi/10.1126/...
This is the authors' model:
www.science.org/doi/10.1126/...
This is the authors' model:
May 25, 2025 at 8:16 PM
This paper from late 2023 got a lot of attention in both the scientific and popular press based on the claim that the effective population size of humans was reduced to 1,280 individuals about 900k years ago
www.science.org/doi/10.1126/...
This is the authors' model:
www.science.org/doi/10.1126/...
This is the authors' model:
I was today years old when I realized that the Chromosome 2 fusion event which is unique to modern humans probably coincides with a possible population bottleneck event ~900kya.
Could the one have caused the other?
This is my adaptation of the published figure
DOI: 10.1126/science.abq7487
Could the one have caused the other?
This is my adaptation of the published figure
DOI: 10.1126/science.abq7487
May 25, 2025 at 8:10 PM
I was today years old when I realized that the Chromosome 2 fusion event which is unique to modern humans probably coincides with a possible population bottleneck event ~900kya.
Could the one have caused the other?
This is my adaptation of the published figure
DOI: 10.1126/science.abq7487
Could the one have caused the other?
This is my adaptation of the published figure
DOI: 10.1126/science.abq7487
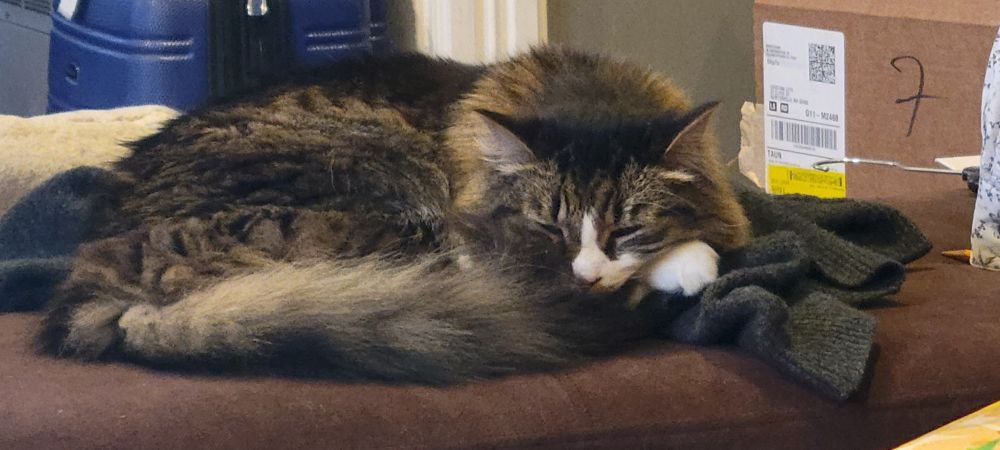
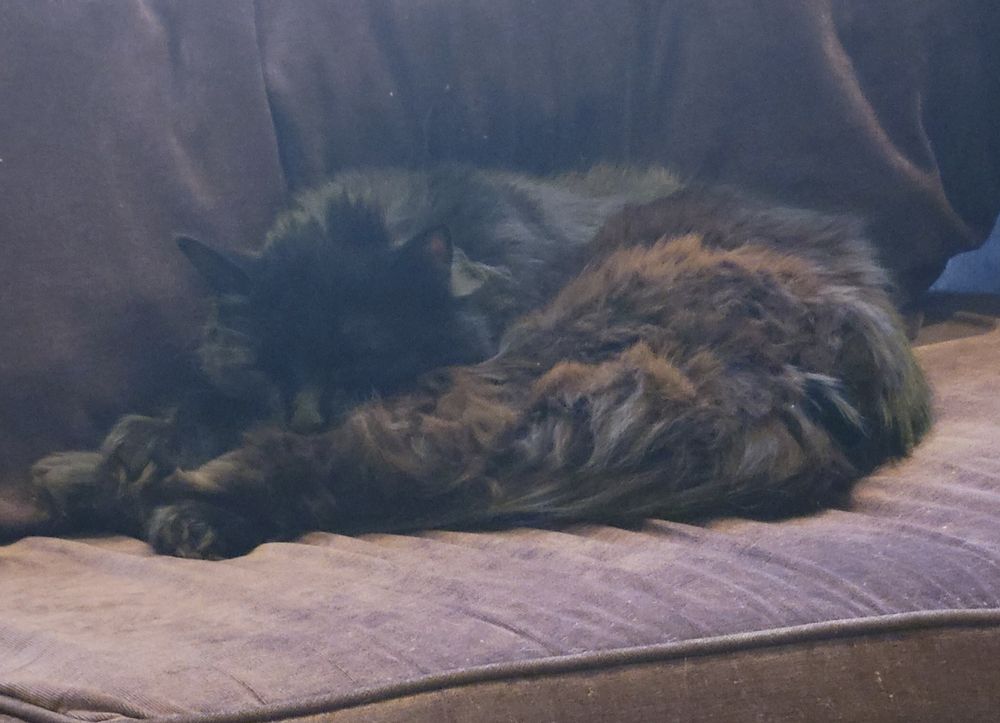
Happy Caturday!
These are Mage and Moxie, brothers to my avatar cat, Mojo.
These are Mage and Moxie, brothers to my avatar cat, Mojo.

May 11, 2025 at 12:23 AM
Happy Caturday!
These are Mage and Moxie, brothers to my avatar cat, Mojo.
These are Mage and Moxie, brothers to my avatar cat, Mojo.
It is now 2025.
There are 10s of thousands of gwas.
I hope @opentargets and similar tools will make it easier for everyone to consider the full complement of phenotypes caused by the genetic variant of interest.
In my experience this makes it far easier to infer the likely causal gene.
There are 10s of thousands of gwas.
I hope @opentargets and similar tools will make it easier for everyone to consider the full complement of phenotypes caused by the genetic variant of interest.
In my experience this makes it far easier to infer the likely causal gene.
April 13, 2025 at 7:35 PM
It is now 2025.
There are 10s of thousands of gwas.
I hope @opentargets and similar tools will make it easier for everyone to consider the full complement of phenotypes caused by the genetic variant of interest.
In my experience this makes it far easier to infer the likely causal gene.
There are 10s of thousands of gwas.
I hope @opentargets and similar tools will make it easier for everyone to consider the full complement of phenotypes caused by the genetic variant of interest.
In my experience this makes it far easier to infer the likely causal gene.
The two themes, glucose biology and hemoglobin biology, together explain 739 of the HbA1c implicated genes even though they overlap at only 117 implicated genes.
I guess HbA1c really is the perfect blend of a metabolite QTL and a protein QTL!
I guess HbA1c really is the perfect blend of a metabolite QTL and a protein QTL!
April 13, 2025 at 7:26 PM
The two themes, glucose biology and hemoglobin biology, together explain 739 of the HbA1c implicated genes even though they overlap at only 117 implicated genes.
I guess HbA1c really is the perfect blend of a metabolite QTL and a protein QTL!
I guess HbA1c really is the perfect blend of a metabolite QTL and a protein QTL!
So that's what I did. I wrote a script to loop through all HbA1c loci, and for each locus I recorded all the other phenotypes that colocalize with HbA1c.
1300 unique traits
999 unique gene symbols.
What did I find?
1300 unique traits
999 unique gene symbols.
What did I find?

April 13, 2025 at 7:09 PM
So that's what I did. I wrote a script to loop through all HbA1c loci, and for each locus I recorded all the other phenotypes that colocalize with HbA1c.
1300 unique traits
999 unique gene symbols.
What did I find?
1300 unique traits
999 unique gene symbols.
What did I find?
Are we now committed to clicking on 700 loci are perusing hundreds of colocalized phenotypes?
This is where we can take advantage of one of the coolest features of the @opentargets.org platform
Every table has a link to the graphql api query to programmatically reproduce that table!
This is where we can take advantage of one of the coolest features of the @opentargets.org platform
Every table has a link to the graphql api query to programmatically reproduce that table!

April 13, 2025 at 7:00 PM
Are we now committed to clicking on 700 loci are perusing hundreds of colocalized phenotypes?
This is where we can take advantage of one of the coolest features of the @opentargets.org platform
Every table has a link to the graphql api query to programmatically reproduce that table!
This is where we can take advantage of one of the coolest features of the @opentargets.org platform
Every table has a link to the graphql api query to programmatically reproduce that table!
But there are over 700 loci. What if we pick another one. Clicking vote on the second locus identifies a completely different set of phenotypes, these ones all related to hemoglobin biology!
platform.opentargets.org/credible-set...
platform.opentargets.org/credible-set...

April 13, 2025 at 6:56 PM
But there are over 700 loci. What if we pick another one. Clicking vote on the second locus identifies a completely different set of phenotypes, these ones all related to hemoglobin biology!
platform.opentargets.org/credible-set...
platform.opentargets.org/credible-set...
If you click on "view" here you learn more about that specific locus
Specifically we see that all the colocalized traits are related to glucose metabolism.
So maybe HbA1c, the combo of hemoglobin and glucose, behaves just like glucose.
Specifically we see that all the colocalized traits are related to glucose metabolism.
So maybe HbA1c, the combo of hemoglobin and glucose, behaves just like glucose.


April 13, 2025 at 6:53 PM
If you click on "view" here you learn more about that specific locus
Specifically we see that all the colocalized traits are related to glucose metabolism.
So maybe HbA1c, the combo of hemoglobin and glucose, behaves just like glucose.
Specifically we see that all the colocalized traits are related to glucose metabolism.
So maybe HbA1c, the combo of hemoglobin and glucose, behaves just like glucose.
I've been exploring the new @opentargets.org platform with one of my favorite phenotypes, HbA1c.
I like looking at metabolite QTLs and protein QTLs, so HbA1c is the perfect all-star combo.
Glucose plus hemoglobin!
A metabolite and a protein!
Which genetic signals dominate?
I like looking at metabolite QTLs and protein QTLs, so HbA1c is the perfect all-star combo.
Glucose plus hemoglobin!
A metabolite and a protein!
Which genetic signals dominate?

April 13, 2025 at 6:46 PM
I've been exploring the new @opentargets.org platform with one of my favorite phenotypes, HbA1c.
I like looking at metabolite QTLs and protein QTLs, so HbA1c is the perfect all-star combo.
Glucose plus hemoglobin!
A metabolite and a protein!
Which genetic signals dominate?
I like looking at metabolite QTLs and protein QTLs, so HbA1c is the perfect all-star combo.
Glucose plus hemoglobin!
A metabolite and a protein!
Which genetic signals dominate?
The cleanest way to consider all colocalized phenotypes is to actually attempt the colocalization of your signal against all other phenotypes, but that would require cleaning, harmonizing and fine mapping all other phenotypes.
And who has the time and resources to do all that?
@opentargets.org
And who has the time and resources to do all that?
@opentargets.org

April 13, 2025 at 6:42 PM
The cleanest way to consider all colocalized phenotypes is to actually attempt the colocalization of your signal against all other phenotypes, but that would require cleaning, harmonizing and fine mapping all other phenotypes.
And who has the time and resources to do all that?
@opentargets.org
And who has the time and resources to do all that?
@opentargets.org