


Danny Shaw
@dannyshaw.bsky.social
Journalist, specialising in policing, crime, justice, prisons, security & immigration. Ex-BBC home affairs correspondent & former adviser to Yvette Cooper MP. These are all my views!
All the latest ONS crime stats here:
ons.gov.uk/peoplepopula...
The homicide analysis was published in February:
ons.gov.uk/peoplepopula...
ons.gov.uk/peoplepopula...
The homicide analysis was published in February:
ons.gov.uk/peoplepopula...
Crime in England and Wales - Office for National Statistics
Crime against households and people aged 16 years and over, using data from police recorded crime and the Crime Survey for England and Wales (CSEW).
ons.gov.uk
October 23, 2025 at 11:39 AM
All the latest ONS crime stats here:
ons.gov.uk/peoplepopula...
The homicide analysis was published in February:
ons.gov.uk/peoplepopula...
ons.gov.uk/peoplepopula...
The homicide analysis was published in February:
ons.gov.uk/peoplepopula...
Over the last year, July 24-June 25, 9 police forces accounted for over half (269) of all 518 homicides.
Homicides fell in the top 3: Met, West Midlands & Greater Manchester.
But went up in the other 6.
Also, big drops in Avon/Somerset (22 to 8 homicides) and South Yorkshire Police (19 to 8).
Homicides fell in the top 3: Met, West Midlands & Greater Manchester.
But went up in the other 6.
Also, big drops in Avon/Somerset (22 to 8 homicides) and South Yorkshire Police (19 to 8).
October 23, 2025 at 11:39 AM
Over the last year, July 24-June 25, 9 police forces accounted for over half (269) of all 518 homicides.
Homicides fell in the top 3: Met, West Midlands & Greater Manchester.
But went up in the other 6.
Also, big drops in Avon/Somerset (22 to 8 homicides) and South Yorkshire Police (19 to 8).
Homicides fell in the top 3: Met, West Midlands & Greater Manchester.
But went up in the other 6.
Also, big drops in Avon/Somerset (22 to 8 homicides) and South Yorkshire Police (19 to 8).
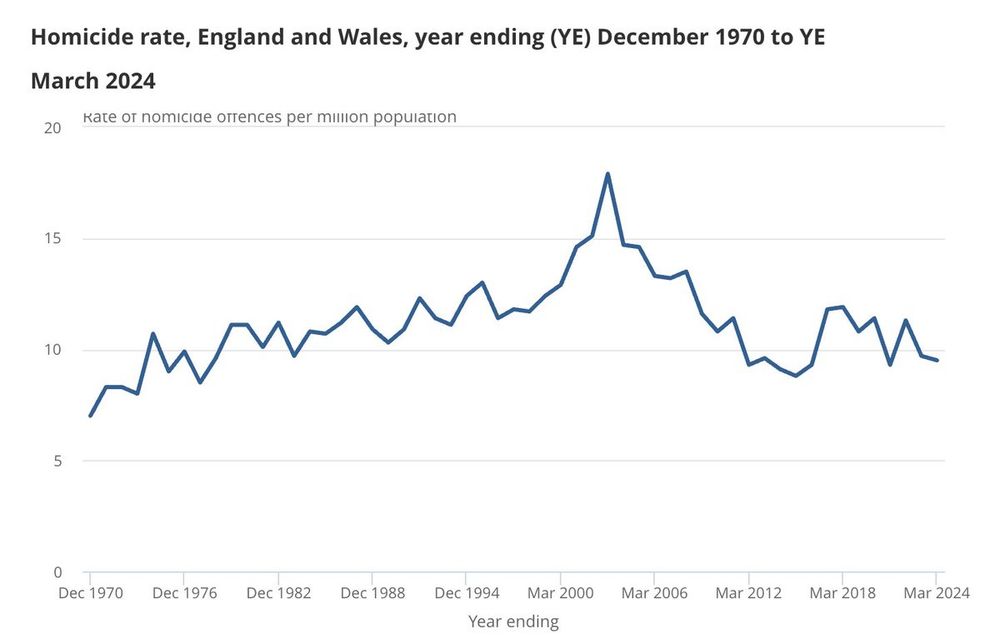
Rate of homicide - ie taking account of the population - is now at its lowest (8.4) since 1973, when it was 8 per million people.
This ONS graph shows the homicide rate to March 2024. It has fallen further since then. The spikes are due to specific fatal incidents:
This ONS graph shows the homicide rate to March 2024. It has fallen further since then. The spikes are due to specific fatal incidents:
October 23, 2025 at 11:39 AM
Rate of homicide - ie taking account of the population - is now at its lowest (8.4) since 1973, when it was 8 per million people.
This ONS graph shows the homicide rate to March 2024. It has fallen further since then. The spikes are due to specific fatal incidents:
This ONS graph shows the homicide rate to March 2024. It has fallen further since then. The spikes are due to specific fatal incidents:
Homicide figures affected by major incidents, eg Hillsborough, Harold Shipman murders, terrorist attacks..
...so important not to focus on one or two years...
...but the trend is clear & vital to understand why.
Improvements in life-saving medical techniques only part of the answer...
...so important not to focus on one or two years...
...but the trend is clear & vital to understand why.
Improvements in life-saving medical techniques only part of the answer...
October 23, 2025 at 11:39 AM
Homicide figures affected by major incidents, eg Hillsborough, Harold Shipman murders, terrorist attacks..
...so important not to focus on one or two years...
...but the trend is clear & vital to understand why.
Improvements in life-saving medical techniques only part of the answer...
...so important not to focus on one or two years...
...but the trend is clear & vital to understand why.
Improvements in life-saving medical techniques only part of the answer...
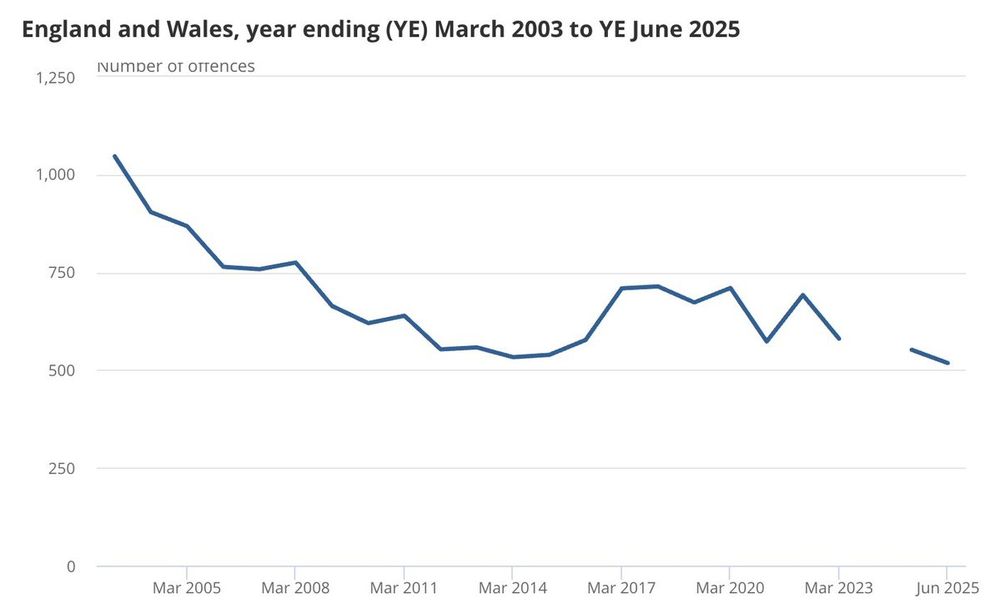
Going back further, murder/manslaughter cases are the lowest since 1977, when 484 deaths were initially classed as 'homicide'.
Homicide rate 8.4 per 1 million people, down from 9.2 last year.
38% of victims fatally stabbed, down from 43%
ONS graph of recent homicide trends:
Homicide rate 8.4 per 1 million people, down from 9.2 last year.
38% of victims fatally stabbed, down from 43%
ONS graph of recent homicide trends:
October 23, 2025 at 11:39 AM
Going back further, murder/manslaughter cases are the lowest since 1977, when 484 deaths were initially classed as 'homicide'.
Homicide rate 8.4 per 1 million people, down from 9.2 last year.
38% of victims fatally stabbed, down from 43%
ONS graph of recent homicide trends:
Homicide rate 8.4 per 1 million people, down from 9.2 last year.
38% of victims fatally stabbed, down from 43%
ONS graph of recent homicide trends:

Race hate up 6% to 82,490 offences, near-record levels
Asian victims 33%
White 30%
Black 23%
Mixed race 8%
(Where ethnicity is known)
Hate crime data comparing 2024/25 with previous years exclude Met Police because counting methods changed.
Analysis of 2024/25 includes Met data
Source:Home Office
Asian victims 33%
White 30%
Black 23%
Mixed race 8%
(Where ethnicity is known)
Hate crime data comparing 2024/25 with previous years exclude Met Police because counting methods changed.
Analysis of 2024/25 includes Met data
Source:Home Office
October 9, 2025 at 10:18 AM
Race hate up 6% to 82,490 offences, near-record levels
Asian victims 33%
White 30%
Black 23%
Mixed race 8%
(Where ethnicity is known)
Hate crime data comparing 2024/25 with previous years exclude Met Police because counting methods changed.
Analysis of 2024/25 includes Met data
Source:Home Office
Asian victims 33%
White 30%
Black 23%
Mixed race 8%
(Where ethnicity is known)
Hate crime data comparing 2024/25 with previous years exclude Met Police because counting methods changed.
Analysis of 2024/25 includes Met data
Source:Home Office
Police-recorded religious hate crime figures show that Jews are more likely to be victims than any other religious group: 106 crimes per 10,000 Jews. Muslims next: 12 per 10,000 Muslims.
Source: Home Office
Source: Home Office

October 9, 2025 at 10:16 AM
Police-recorded religious hate crime figures show that Jews are more likely to be victims than any other religious group: 106 crimes per 10,000 Jews. Muslims next: 12 per 10,000 Muslims.
Source: Home Office
Source: Home Office