


Callum Thomas
@topdowncharts.bsky.social
Head of Research & Founder at Topdown Charts
(chart-driven macro insights for investors)
(chart-driven macro insights for investors)
Weekly Macro/Multi-Asset report
-Global loan demand
-Credit spreads (and private credit)
-Stocks vs Bonds
-Global ex-US Equities
-GSV vs ULG
Download the report here: www.topdowncharts.pro/p/weekly-mac...
-Global loan demand
-Credit spreads (and private credit)
-Stocks vs Bonds
-Global ex-US Equities
-GSV vs ULG
Download the report here: www.topdowncharts.pro/p/weekly-mac...

November 14, 2025 at 8:50 AM
Weekly Macro/Multi-Asset report
-Global loan demand
-Credit spreads (and private credit)
-Stocks vs Bonds
-Global ex-US Equities
-GSV vs ULG
Download the report here: www.topdowncharts.pro/p/weekly-mac...
-Global loan demand
-Credit spreads (and private credit)
-Stocks vs Bonds
-Global ex-US Equities
-GSV vs ULG
Download the report here: www.topdowncharts.pro/p/weekly-mac...
Did you know...
...the higher the valuation, the lower future returns are likely to be?
And we see this playout in both *absolute* and *relative* returns
Detail: entrylevel.topdowncharts.com/p/important-...
...the higher the valuation, the lower future returns are likely to be?
And we see this playout in both *absolute* and *relative* returns
Detail: entrylevel.topdowncharts.com/p/important-...

November 14, 2025 at 3:00 AM
Did you know...
...the higher the valuation, the lower future returns are likely to be?
And we see this playout in both *absolute* and *relative* returns
Detail: entrylevel.topdowncharts.com/p/important-...
...the higher the valuation, the lower future returns are likely to be?
And we see this playout in both *absolute* and *relative* returns
Detail: entrylevel.topdowncharts.com/p/important-...
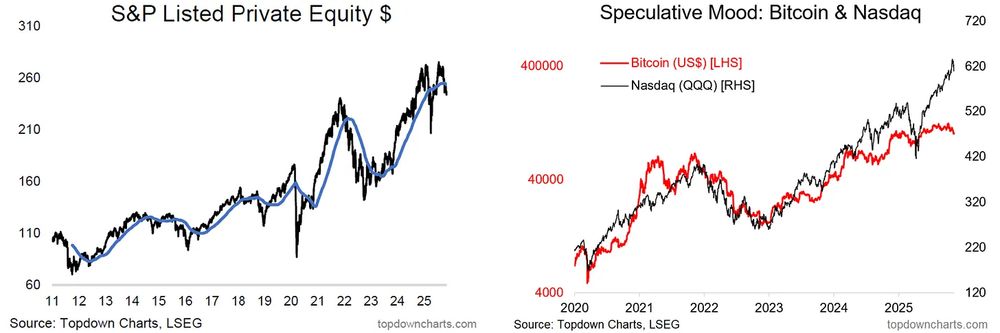
Tide is Turning... 👀
"I keep coming back to this chart as barometer of speculative risk appetite and liquidity (+potential early-warning indicator). To that end, with bitcoin rolling over and tech topping out, it’s not a good sign."
From: www.chartstorm.info/p/weekly-s-a...
"I keep coming back to this chart as barometer of speculative risk appetite and liquidity (+potential early-warning indicator). To that end, with bitcoin rolling over and tech topping out, it’s not a good sign."
From: www.chartstorm.info/p/weekly-s-a...

November 13, 2025 at 6:35 PM
Tide is Turning... 👀
"I keep coming back to this chart as barometer of speculative risk appetite and liquidity (+potential early-warning indicator). To that end, with bitcoin rolling over and tech topping out, it’s not a good sign."
From: www.chartstorm.info/p/weekly-s-a...
"I keep coming back to this chart as barometer of speculative risk appetite and liquidity (+potential early-warning indicator). To that end, with bitcoin rolling over and tech topping out, it’s not a good sign."
From: www.chartstorm.info/p/weekly-s-a...
The "Relative Return Procession" is progressing...
Next up?
Gold breaking out vs stocks. 👀
Next up?
Gold breaking out vs stocks. 👀

November 13, 2025 at 5:01 PM
The "Relative Return Procession" is progressing...
Next up?
Gold breaking out vs stocks. 👀
Next up?
Gold breaking out vs stocks. 👀
"in the long-run stocks go up"
Yep.
But sometimes they not only don't go up, but actually get f----d up.
Here's some horrific examples.
As featured in the Weekly ChartStorm www.chartstorm.info/p/weekly-s-a...
Yep.
But sometimes they not only don't go up, but actually get f----d up.
Here's some horrific examples.
As featured in the Weekly ChartStorm www.chartstorm.info/p/weekly-s-a...

November 13, 2025 at 3:00 AM
"in the long-run stocks go up"
Yep.
But sometimes they not only don't go up, but actually get f----d up.
Here's some horrific examples.
As featured in the Weekly ChartStorm www.chartstorm.info/p/weekly-s-a...
Yep.
But sometimes they not only don't go up, but actually get f----d up.
Here's some horrific examples.
As featured in the Weekly ChartStorm www.chartstorm.info/p/weekly-s-a...
ICYMI: 2026 Outlook Webinar Replay (+Slide Pack) entrylevel.topdowncharts.com/p/video-2026...

[Video] 2026 Outlook Webinar Replay (+Slide Pack)
The big picture themes, asset allocation issues, and big ideas for 2026...
entrylevel.topdowncharts.com
November 13, 2025 at 1:47 AM
ICYMI: 2026 Outlook Webinar Replay (+Slide Pack) entrylevel.topdowncharts.com/p/video-2026...
Semi's Sign 'o the Times...
Bulls: this is fine, this is the new normal, it's backed by earnings, it's high for good reason.
Bears: this is dot-com 2.0, earnings are unsustainable, AI bubble.
The Truth?
Probably somewhere in between: www.chartstorm.info/p/weekly-s-a...
Bulls: this is fine, this is the new normal, it's backed by earnings, it's high for good reason.
Bears: this is dot-com 2.0, earnings are unsustainable, AI bubble.
The Truth?
Probably somewhere in between: www.chartstorm.info/p/weekly-s-a...

November 12, 2025 at 9:50 PM
Semi's Sign 'o the Times...
Bulls: this is fine, this is the new normal, it's backed by earnings, it's high for good reason.
Bears: this is dot-com 2.0, earnings are unsustainable, AI bubble.
The Truth?
Probably somewhere in between: www.chartstorm.info/p/weekly-s-a...
Bulls: this is fine, this is the new normal, it's backed by earnings, it's high for good reason.
Bears: this is dot-com 2.0, earnings are unsustainable, AI bubble.
The Truth?
Probably somewhere in between: www.chartstorm.info/p/weekly-s-a...
Gold Bull Consolidations
It's entirely normal for big gold bull markets to have long pauses, and if anything the entire up-move in gold almost only happens over a few key weeks and days...
Further thoughts: gold.topdowncharts.com/p/goldnugget...
It's entirely normal for big gold bull markets to have long pauses, and if anything the entire up-move in gold almost only happens over a few key weeks and days...
Further thoughts: gold.topdowncharts.com/p/goldnugget...

November 12, 2025 at 5:01 PM
Gold Bull Consolidations
It's entirely normal for big gold bull markets to have long pauses, and if anything the entire up-move in gold almost only happens over a few key weeks and days...
Further thoughts: gold.topdowncharts.com/p/goldnugget...
It's entirely normal for big gold bull markets to have long pauses, and if anything the entire up-move in gold almost only happens over a few key weeks and days...
Further thoughts: gold.topdowncharts.com/p/goldnugget...
Global Equities "Relative Value Trinity"
...something for those focused on the next 3-5 years and beyond (vs the next 3-5 days or hours for that matter!)
Explained: entrylevel.topdowncharts.com/p/chart-of-t...
...something for those focused on the next 3-5 years and beyond (vs the next 3-5 days or hours for that matter!)
Explained: entrylevel.topdowncharts.com/p/chart-of-t...

November 12, 2025 at 3:00 AM
Global Equities "Relative Value Trinity"
...something for those focused on the next 3-5 years and beyond (vs the next 3-5 days or hours for that matter!)
Explained: entrylevel.topdowncharts.com/p/chart-of-t...
...something for those focused on the next 3-5 years and beyond (vs the next 3-5 days or hours for that matter!)
Explained: entrylevel.topdowncharts.com/p/chart-of-t...
Big Breakout in Japanese stocks
(but no one believes it)
Conventional wisdom says Japan is demographically doomed, but the conventional wisdom is based on an incomplete understanding that has missed several major developments...
Here's the big picture: entrylevel.topdowncharts.com/p/chart-of-t...
(but no one believes it)
Conventional wisdom says Japan is demographically doomed, but the conventional wisdom is based on an incomplete understanding that has missed several major developments...
Here's the big picture: entrylevel.topdowncharts.com/p/chart-of-t...

November 12, 2025 at 1:35 AM
Big Breakout in Japanese stocks
(but no one believes it)
Conventional wisdom says Japan is demographically doomed, but the conventional wisdom is based on an incomplete understanding that has missed several major developments...
Here's the big picture: entrylevel.topdowncharts.com/p/chart-of-t...
(but no one believes it)
Conventional wisdom says Japan is demographically doomed, but the conventional wisdom is based on an incomplete understanding that has missed several major developments...
Here's the big picture: entrylevel.topdowncharts.com/p/chart-of-t...
AI Earnings Euphoria 👀
Wall Street, Investors, Consumers -- all agree on one thing: www.chartstorm.info/p/weekly-s-a...
Wall Street, Investors, Consumers -- all agree on one thing: www.chartstorm.info/p/weekly-s-a...

November 12, 2025 at 12:24 AM
AI Earnings Euphoria 👀
Wall Street, Investors, Consumers -- all agree on one thing: www.chartstorm.info/p/weekly-s-a...
Wall Street, Investors, Consumers -- all agree on one thing: www.chartstorm.info/p/weekly-s-a...
2026 Big Ideas Outlook Webinar
-big picture perspectives
-big moves underway already
-big ideas and things to watch for
Wednesday 2pm EST -- Register: us06web.zoom.us/webinar/regi...
-big picture perspectives
-big moves underway already
-big ideas and things to watch for
Wednesday 2pm EST -- Register: us06web.zoom.us/webinar/regi...

November 11, 2025 at 6:49 PM
2026 Big Ideas Outlook Webinar
-big picture perspectives
-big moves underway already
-big ideas and things to watch for
Wednesday 2pm EST -- Register: us06web.zoom.us/webinar/regi...
-big picture perspectives
-big moves underway already
-big ideas and things to watch for
Wednesday 2pm EST -- Register: us06web.zoom.us/webinar/regi...
Gold Miners have been in a rang-trading stalemate vs stocks over the past decade, but there's a Big chance this stalemate gets broken, and soon...
Thoughts: gold.topdowncharts.com/p/goldnugget...
Thoughts: gold.topdowncharts.com/p/goldnugget...

November 11, 2025 at 4:55 PM
Gold Miners have been in a rang-trading stalemate vs stocks over the past decade, but there's a Big chance this stalemate gets broken, and soon...
Thoughts: gold.topdowncharts.com/p/goldnugget...
Thoughts: gold.topdowncharts.com/p/goldnugget...
The Great Deleveraging
Thanks to scars of the financial crisis spurring folk to be more prudent with debt and of course — more-to-the-point: the dream run in stocks and property on the asset side...
US household leverage (as measured by debt as a % of assets) has dropped to multi-decade lows.
W
Thanks to scars of the financial crisis spurring folk to be more prudent with debt and of course — more-to-the-point: the dream run in stocks and property on the asset side...
US household leverage (as measured by debt as a % of assets) has dropped to multi-decade lows.
W

November 11, 2025 at 3:00 AM
The Great Deleveraging
Thanks to scars of the financial crisis spurring folk to be more prudent with debt and of course — more-to-the-point: the dream run in stocks and property on the asset side...
US household leverage (as measured by debt as a % of assets) has dropped to multi-decade lows.
W
Thanks to scars of the financial crisis spurring folk to be more prudent with debt and of course — more-to-the-point: the dream run in stocks and property on the asset side...
US household leverage (as measured by debt as a % of assets) has dropped to multi-decade lows.
W
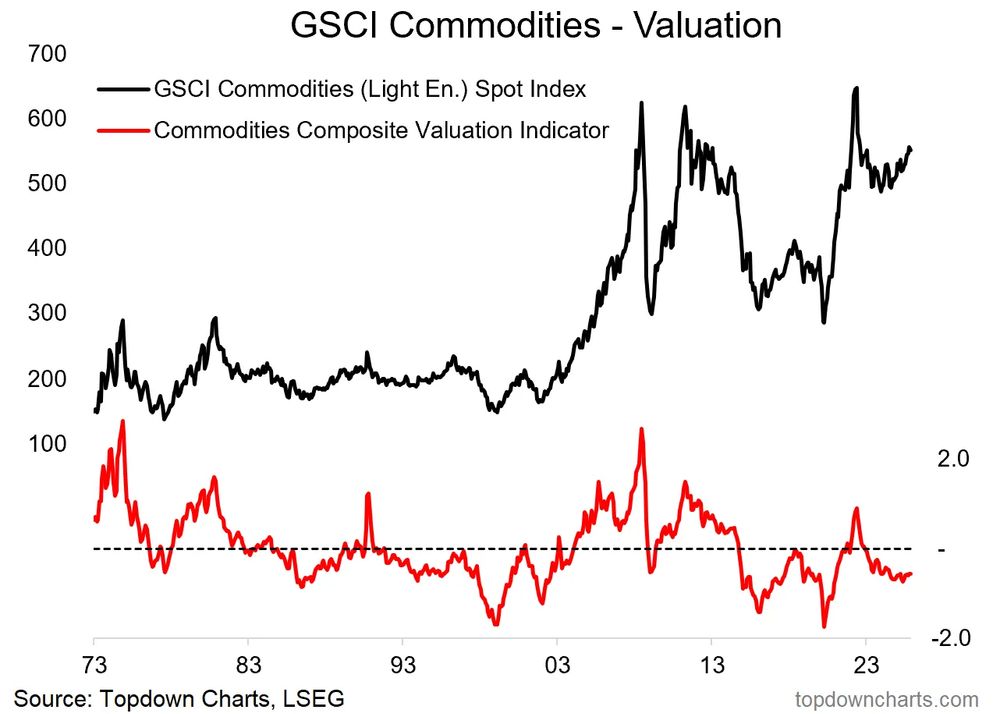
Chart of the Week - Commodities entrylevel.topdowncharts.com/p/chart-of-t...
"this is *the* key asset class to watch in the coming months and years"
"this is *the* key asset class to watch in the coming months and years"
November 10, 2025 at 11:54 PM
Chart of the Week - Commodities entrylevel.topdowncharts.com/p/chart-of-t...
"this is *the* key asset class to watch in the coming months and years"
"this is *the* key asset class to watch in the coming months and years"
The Gold/Stock ratio is breaking out of a Multi-Decade triangle pattern -- this could be the start of a major change in market regime...
Explained: gold.topdowncharts.com/p/goldnugget...
Explained: gold.topdowncharts.com/p/goldnugget...

November 10, 2025 at 7:41 PM
The Gold/Stock ratio is breaking out of a Multi-Decade triangle pattern -- this could be the start of a major change in market regime...
Explained: gold.topdowncharts.com/p/goldnugget...
Explained: gold.topdowncharts.com/p/goldnugget...
Unbelievable and Unthinkable to many ---this expected returns table is not going to be popular.
What worked well in the past may not work so well in the future... but thanks to various biases and industry pressures, the below picture will be too hard a pill for most to swallow.
What worked well in the past may not work so well in the future... but thanks to various biases and industry pressures, the below picture will be too hard a pill for most to swallow.

November 10, 2025 at 3:00 AM
Unbelievable and Unthinkable to many ---this expected returns table is not going to be popular.
What worked well in the past may not work so well in the future... but thanks to various biases and industry pressures, the below picture will be too hard a pill for most to swallow.
What worked well in the past may not work so well in the future... but thanks to various biases and industry pressures, the below picture will be too hard a pill for most to swallow.
Weekly Insights - Edition 235 entrylevel.topdowncharts.com/p/weekly-ins...
This week: global markets update, risk-off moves, renewable energy stocks, ESG ebb and flow, macro radar, monthly pack link, updated ideas table...
This week: global markets update, risk-off moves, renewable energy stocks, ESG ebb and flow, macro radar, monthly pack link, updated ideas table...
November 10, 2025 at 2:56 AM
Weekly Insights - Edition 235 entrylevel.topdowncharts.com/p/weekly-ins...
This week: global markets update, risk-off moves, renewable energy stocks, ESG ebb and flow, macro radar, monthly pack link, updated ideas table...
This week: global markets update, risk-off moves, renewable energy stocks, ESG ebb and flow, macro radar, monthly pack link, updated ideas table...
ALERT: the latest edition of the "GoldNuggets Digest" will be sent out shortly, be sure to join the email list [free] to receive a copy: gold.topdowncharts.com/s/goldnuggets

November 10, 2025 at 1:51 AM
ALERT: the latest edition of the "GoldNuggets Digest" will be sent out shortly, be sure to join the email list [free] to receive a copy: gold.topdowncharts.com/s/goldnuggets
Forget measures like Volatility or the VIX ---the real measure of Risk for investors is this.
Even though stocks go up over the long-run, they can take large and extended forays to the downside.
(...aka what the finfluencers don't tell you about index investing!)
Even though stocks go up over the long-run, they can take large and extended forays to the downside.
(...aka what the finfluencers don't tell you about index investing!)

November 9, 2025 at 3:00 AM
Forget measures like Volatility or the VIX ---the real measure of Risk for investors is this.
Even though stocks go up over the long-run, they can take large and extended forays to the downside.
(...aka what the finfluencers don't tell you about index investing!)
Even though stocks go up over the long-run, they can take large and extended forays to the downside.
(...aka what the finfluencers don't tell you about index investing!)
Weekly S&P500 ChartStorm coming soon... 👀
Meantime, check out last week's edition + subscribe: www.chartstorm.info/p/weekly-s-a...
Meantime, check out last week's edition + subscribe: www.chartstorm.info/p/weekly-s-a...

Weekly S&P500 ChartStorm - 2 November 2025
This week: monthly charts, seasonality, technical check, valuations, profit margin prophets, foreign owners, long-term asset returns, tech vs non-tech, global vs US...
www.chartstorm.info
November 8, 2025 at 10:56 AM
Weekly S&P500 ChartStorm coming soon... 👀
Meantime, check out last week's edition + subscribe: www.chartstorm.info/p/weekly-s-a...
Meantime, check out last week's edition + subscribe: www.chartstorm.info/p/weekly-s-a...
You've probably seen the CAPE or PE10 ratios for global equities before, but have you seen the E-10?
This chart shows the 10-year moving average of earnings for global equities, and it is extremely telling...
Source: entrylevel.topdowncharts.com/p/charts-of-...
This chart shows the 10-year moving average of earnings for global equities, and it is extremely telling...
Source: entrylevel.topdowncharts.com/p/charts-of-...

November 8, 2025 at 3:00 AM
You've probably seen the CAPE or PE10 ratios for global equities before, but have you seen the E-10?
This chart shows the 10-year moving average of earnings for global equities, and it is extremely telling...
Source: entrylevel.topdowncharts.com/p/charts-of-...
This chart shows the 10-year moving average of earnings for global equities, and it is extremely telling...
Source: entrylevel.topdowncharts.com/p/charts-of-...
Market Cycle Guidebook - October 2025
Asset class views, macro outlook, long-term expectations, and over 70 charts tracking macro policy, cycle data, and valuations across a global multi-asset universe...
Download the Report: www.topdowncharts.pro/p/market-cyc...
Asset class views, macro outlook, long-term expectations, and over 70 charts tracking macro policy, cycle data, and valuations across a global multi-asset universe...
Download the Report: www.topdowncharts.pro/p/market-cyc...

November 7, 2025 at 7:03 PM
Market Cycle Guidebook - October 2025
Asset class views, macro outlook, long-term expectations, and over 70 charts tracking macro policy, cycle data, and valuations across a global multi-asset universe...
Download the Report: www.topdowncharts.pro/p/market-cyc...
Asset class views, macro outlook, long-term expectations, and over 70 charts tracking macro policy, cycle data, and valuations across a global multi-asset universe...
Download the Report: www.topdowncharts.pro/p/market-cyc...
Gold vs Silver vs Base Metals
This is one of the most important charts in commodities.
We are witnessing a transition and procession in price momentum from Monetary Metals to Industrial Metals.
And this is only part of the story... Read More: gold.topdowncharts.com/p/goldnugget...
This is one of the most important charts in commodities.
We are witnessing a transition and procession in price momentum from Monetary Metals to Industrial Metals.
And this is only part of the story... Read More: gold.topdowncharts.com/p/goldnugget...

November 7, 2025 at 5:03 PM
Gold vs Silver vs Base Metals
This is one of the most important charts in commodities.
We are witnessing a transition and procession in price momentum from Monetary Metals to Industrial Metals.
And this is only part of the story... Read More: gold.topdowncharts.com/p/goldnugget...
This is one of the most important charts in commodities.
We are witnessing a transition and procession in price momentum from Monetary Metals to Industrial Metals.
And this is only part of the story... Read More: gold.topdowncharts.com/p/goldnugget...
Chart: Australian Stock/Bond Ratio
An Aussie anomaly is presenting potential angst for asset allocators: australia.topdowncharts.com/p/chart-aust...
An Aussie anomaly is presenting potential angst for asset allocators: australia.topdowncharts.com/p/chart-aust...

November 7, 2025 at 4:24 AM
Chart: Australian Stock/Bond Ratio
An Aussie anomaly is presenting potential angst for asset allocators: australia.topdowncharts.com/p/chart-aust...
An Aussie anomaly is presenting potential angst for asset allocators: australia.topdowncharts.com/p/chart-aust...