


Alaskans for Sustainable Budgets
@ak4sb.bsky.social
A non-partisan project focused on helping develop and advocate for responsible state and federal fiscal policies.
This Week's Friday Column| Lt Gov Nancy Dahlstrom claims that amending the Constitution to adopt a "one-account" Permanent Fund approach would "guarantee" a PFD. Her column is an effort to gaslight Alaskans.. #akleg buff.ly/YSVTSDP

December 7, 2025 at 8:30 PM
This Week's Friday Column| Lt Gov Nancy Dahlstrom claims that amending the Constitution to adopt a "one-account" Permanent Fund approach would "guarantee" a PFD. Her column is an effort to gaslight Alaskans.. #akleg buff.ly/YSVTSDP
Sumner was a good representative of those in his income bracket, but it's not like they need any more help in the #akleg. We should be finding ways to reduce the income gap between legislators and their constituents, not increase it still further.

December 7, 2025 at 7:00 PM
Sumner was a good representative of those in his income bracket, but it's not like they need any more help in the #akleg. We should be finding ways to reduce the income gap between legislators and their constituents, not increase it still further.
The Sunday Financial Charts| To help better understand the overall financial environment, weekly we track current + projected inflation & interest rates. #akleg
𝙄𝙣𝙛𝙡𝙖𝙩𝙞𝙤𝙣: We follow two measures of inflation:
1/4
𝙄𝙣𝙛𝙡𝙖𝙩𝙞𝙤𝙣: We follow two measures of inflation:
1/4
December 7, 2025 at 5:30 PM
The Sunday Financial Charts| To help better understand the overall financial environment, weekly we track current + projected inflation & interest rates. #akleg
𝙄𝙣𝙛𝙡𝙖𝙩𝙞𝙤𝙣: We follow two measures of inflation:
1/4
𝙄𝙣𝙛𝙡𝙖𝙩𝙞𝙤𝙣: We follow two measures of inflation:
1/4
The Sunday Chart| To help assess the ANS market, wkly we review the status of the ANS tanker fleet. Notes: 1 (HIL) moored at KR for maint; no MPC in service. #akleg
* Deliveries month to date: 4.5
* Not in ANS service: 1 (HIL maint.)
* Asia: 0
* USWC: 9 (5 CP, 2 HIL, 2 XOM) in runs
* Deliveries month to date: 4.5
* Not in ANS service: 1 (HIL maint.)
* Asia: 0
* USWC: 9 (5 CP, 2 HIL, 2 XOM) in runs

December 7, 2025 at 4:12 PM
The Sunday Chart| To help assess the ANS market, wkly we review the status of the ANS tanker fleet. Notes: 1 (HIL) moored at KR for maint; no MPC in service. #akleg
* Deliveries month to date: 4.5
* Not in ANS service: 1 (HIL maint.)
* Asia: 0
* USWC: 9 (5 CP, 2 HIL, 2 XOM) in runs
* Deliveries month to date: 4.5
* Not in ANS service: 1 (HIL maint.)
* Asia: 0
* USWC: 9 (5 CP, 2 HIL, 2 XOM) in runs
The Rolling 4-Wk Avgs| To provide perspective on $$ANS trends as well as the relationship b/w ANS & other reference prices, wkly we chart the 4-wk avg & differentials. Current ANS 4-wk avg $64, ahead of both Brent ($0.95) and Brent/WTI avg ($3.04). #akleg

December 6, 2025 at 10:00 PM
The Rolling 4-Wk Avgs| To provide perspective on $$ANS trends as well as the relationship b/w ANS & other reference prices, wkly we chart the 4-wk avg & differentials. Current ANS 4-wk avg $64, ahead of both Brent ($0.95) and Brent/WTI avg ($3.04). #akleg
Permanent Fund Corp: "We're transparent!!"
Also, Permanent Fund Corp: 60+ days after the close of 1Q 2026, and they STILL haven't reported the Management Fees paid for that quarter. ( 🤫 ... maybe they'll forget.) 🙄🙄
#akleg
Also, Permanent Fund Corp: 60+ days after the close of 1Q 2026, and they STILL haven't reported the Management Fees paid for that quarter. ( 🤫 ... maybe they'll forget.) 🙄🙄
#akleg

December 6, 2025 at 8:30 PM
Permanent Fund Corp: "We're transparent!!"
Also, Permanent Fund Corp: 60+ days after the close of 1Q 2026, and they STILL haven't reported the Management Fees paid for that quarter. ( 🤫 ... maybe they'll forget.) 🙄🙄
#akleg
Also, Permanent Fund Corp: 60+ days after the close of 1Q 2026, and they STILL haven't reported the Management Fees paid for that quarter. ( 🤫 ... maybe they'll forget.) 🙄🙄
#akleg
The Saturday Charts| Each Saturday, we compare current FY gross oil revs v. DOR's most recent (NOW SPRING25) F'cast. W/ 41% of FY26 booked, projected annual gross revs (blue) running even v Spring25 F'cast rev. Projected FY26 WAVG currently $67. #akleg
1/2
1/2

December 6, 2025 at 7:00 PM
The Saturday Charts| Each Saturday, we compare current FY gross oil revs v. DOR's most recent (NOW SPRING25) F'cast. W/ 41% of FY26 booked, projected annual gross revs (blue) running even v Spring25 F'cast rev. Projected FY26 WAVG currently $67. #akleg
1/2
1/2
The 8:35a Chart| Given the importance of Permanent Fund returns to #AKrev levels, we have developed a second morning chart focusing on S&P 500 5-, 3- & 1-yr returns v the PFC's. #akleg
* 5-yr: S&P 13.18% v PFC 9.59%
* 3-yr: S&P 19.77% v PFC 9.76%
* 1-yr: S&P 13.09% v PFC 11.51%
* 5-yr: S&P 13.18% v PFC 9.59%
* 3-yr: S&P 19.77% v PFC 9.76%
* 1-yr: S&P 13.09% v PFC 11.51%

December 6, 2025 at 5:35 PM
This Week's Friday Column| Lt Gov Nancy Dahlstrom claims that amending the Constitution to adopt a "one-account" Permanent Fund approach would "guarantee" a PFD. Her column is an effort to gaslight Alaskans.. #akleg
The Friday column: Dahlstrom is gaslighting Alaskans
Lt Gov Nancy Dahlstrom claims that amending the Constitution to adopt a "one-account" Permanent Fund approach would "guarantee" a PFD. The column is an effort to gaslight Alaskans.
buff.ly
December 6, 2025 at 4:00 PM
This Week's Friday Column| Lt Gov Nancy Dahlstrom claims that amending the Constitution to adopt a "one-account" Permanent Fund approach would "guarantee" a PFD. Her column is an effort to gaslight Alaskans.. #akleg
The Friday P.M. "Goldilocks" Charts| We publish five charts Fri afternoons showing the impact of current futures $$oil on Alaska's fiscal outlook and three alternatives for resolving it. (Background: bit.ly/3UhbLCZ) #akleg
1/6
1/6

Brad Keithley’s chart of the week: The new "Goldilocks" charts
Some readers will know that in addition to these weekly columns, we also regularly produce a series of daily charts focused on various aspects of Alaska oil, gas, and fiscal issues. We call one set…
bit.ly
December 5, 2025 at 10:00 PM
The Friday P.M. "Goldilocks" Charts| We publish five charts Fri afternoons showing the impact of current futures $$oil on Alaska's fiscal outlook and three alternatives for resolving it. (Background: bit.ly/3UhbLCZ) #akleg
1/6
1/6
ICYMI. This Wk's Top 3 P'cast| Why there will be significant uncertainty about oil revenues this coming session, is Lt Gov Dahlstrom duplicitous or just dumb & why Ralph Samuels is a horrible pick for the Permanent Fund Board. #akleg

The Weekly Top 3 (12.1.2025)
Why there will be significant uncertainty about oil revenues this coming session, is Lt Gov Dahlstrom duplicitous or just dumb & why Ralph Samuels is a horrible pick for the Permanent Fund Board
buff.ly
December 5, 2025 at 8:30 PM
ICYMI. This Wk's Top 3 P'cast| Why there will be significant uncertainty about oil revenues this coming session, is Lt Gov Dahlstrom duplicitous or just dumb & why Ralph Samuels is a horrible pick for the Permanent Fund Board. #akleg
The 8:35a Chart| Given the importance of Permanent Fund returns to #AKrev levels, we have developed a second morning chart focusing on S&P 500 5-, 3- & 1-yr returns v the PFC's. #akleg
* 5-yr: S&P 13.14% v PFC 9.59%
* 3-yr: S&P 18.97% v PFC 9.76%
* 1-yr: S&P 12.66% v PFC 11.51%
* 5-yr: S&P 13.14% v PFC 9.59%
* 3-yr: S&P 18.97% v PFC 9.76%
* 1-yr: S&P 12.66% v PFC 11.51%

December 5, 2025 at 5:35 PM
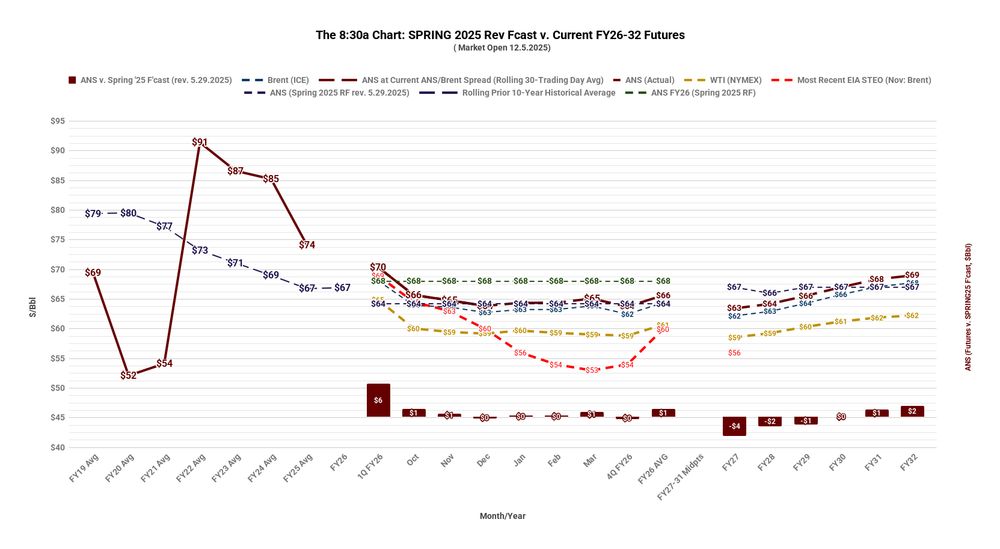
The 8:30a Chart| To provide context to current $$oil, we publish daily (ex-Su) a running avg of FY26-32 $$ANS, Brent & WTI actual+futures. Projected ANS v. SPRING25 rev F'cast:
> FY26 ⬆️ $1 (+$83mil UGF)
> FY27 ⬇️ $4 (-$133mil)
> FY28-32 even (avg annual $0mil)
#akleg
> FY26 ⬆️ $1 (+$83mil UGF)
> FY27 ⬇️ $4 (-$133mil)
> FY28-32 even (avg annual $0mil)
#akleg
December 5, 2025 at 5:30 PM
The 8:30a Chart| To provide context to current $$oil, we publish daily (ex-Su) a running avg of FY26-32 $$ANS, Brent & WTI actual+futures. Projected ANS v. SPRING25 rev F'cast:
> FY26 ⬆️ $1 (+$83mil UGF)
> FY27 ⬇️ $4 (-$133mil)
> FY28-32 even (avg annual $0mil)
#akleg
> FY26 ⬆️ $1 (+$83mil UGF)
> FY27 ⬇️ $4 (-$133mil)
> FY28-32 even (avg annual $0mil)
#akleg
The Friday A.M. Charts| We publish 2 charts Friday mornings. #akleg
First, we chart YTD $$oil + the outlook from the current futures mkt v. DOR's most recent 10-year rev f'cast. Futures: near (⬇️ $2), mid (even) & long-term (⬇️ $1) v. SPRING25 F'cast (rev).
1/2
First, we chart YTD $$oil + the outlook from the current futures mkt v. DOR's most recent 10-year rev f'cast. Futures: near (⬇️ $2), mid (even) & long-term (⬇️ $1) v. SPRING25 F'cast (rev).
1/2

December 5, 2025 at 4:40 PM
The Friday A.M. Charts| We publish 2 charts Friday mornings. #akleg
First, we chart YTD $$oil + the outlook from the current futures mkt v. DOR's most recent 10-year rev f'cast. Futures: near (⬇️ $2), mid (even) & long-term (⬇️ $1) v. SPRING25 F'cast (rev).
1/2
First, we chart YTD $$oil + the outlook from the current futures mkt v. DOR's most recent 10-year rev f'cast. Futures: near (⬇️ $2), mid (even) & long-term (⬇️ $1) v. SPRING25 F'cast (rev).
1/2
This Week's Friday Column| This week, we explain how, by using PFD cuts to fund state government, the Legislature is deepening the disconnect between the Alaska economy, as reflected in GDP, and Alaska household income. #akleg buff.ly/DQ0pjJW

December 4, 2025 at 10:00 PM
This Week's Friday Column| This week, we explain how, by using PFD cuts to fund state government, the Legislature is deepening the disconnect between the Alaska economy, as reflected in GDP, and Alaska household income. #akleg buff.ly/DQ0pjJW
This Wk's Top 3 P'cast| Why there will be significant uncertainty about oil revenues this coming session, is Lt Gov Dahlstrom duplicitous or just dumb & why Ralph Samuels is a horrible pick for the Permanent Fund Board. #akleg buff.ly/LDlr9Bz
The Weekly Top 3 (12.1.2025)
Why there will be significant uncertainty about oil revenues this coming session, is Lt Gov Dahlstrom duplicitous or just dumb & why Ralph Samuels is a horrible pick for the Permanent Fund Board
bgkeithley.substack.com
December 4, 2025 at 7:00 PM
This Wk's Top 3 P'cast| Why there will be significant uncertainty about oil revenues this coming session, is Lt Gov Dahlstrom duplicitous or just dumb & why Ralph Samuels is a horrible pick for the Permanent Fund Board. #akleg buff.ly/LDlr9Bz
The 8:35a Chart| Given the importance of Permanent Fund returns to #AKrev levels, we have developed a second morning chart focusing on S&P 500 5-, 3- & 1-yr returns v the PFC's. #akleg
* 5-yr: S&P 13.31% v PFC 9.59%
* 3-yr: S&P 18.93% v PFC 9.76%
* 1-yr: S&P 13.22% v PFC 11.51%
* 5-yr: S&P 13.31% v PFC 9.59%
* 3-yr: S&P 18.93% v PFC 9.76%
* 1-yr: S&P 13.22% v PFC 11.51%

December 4, 2025 at 5:35 PM
The 8:30a Chart| To provide context to current $$oil, we publish daily (ex-Su) a running avg of FY26-32 $$ANS, Brent & WTI actual+futures. Projected ANS v. SPRING25 rev F'cast:
> FY26 ⬆️ $1 (+$66mil UGF)
> FY27 ⬇️ $4 (-$133mil)
> FY28-32 even (avg annual $0mil)
#akleg
> FY26 ⬆️ $1 (+$66mil UGF)
> FY27 ⬇️ $4 (-$133mil)
> FY28-32 even (avg annual $0mil)
#akleg

December 4, 2025 at 5:30 PM
The 8:30a Chart| To provide context to current $$oil, we publish daily (ex-Su) a running avg of FY26-32 $$ANS, Brent & WTI actual+futures. Projected ANS v. SPRING25 rev F'cast:
> FY26 ⬆️ $1 (+$66mil UGF)
> FY27 ⬇️ $4 (-$133mil)
> FY28-32 even (avg annual $0mil)
#akleg
> FY26 ⬆️ $1 (+$66mil UGF)
> FY27 ⬇️ $4 (-$133mil)
> FY28-32 even (avg annual $0mil)
#akleg
The Thursday Charts| We publish two charts Thursdays. #akleg
Using the prior yr's production profile as a baseline, the first charts YTD production levels compared w/the most recent F'cast (now SPRING25). W/42% of FY26 done, YTD avg (red) running -14kbd (-3%) v. F'cast.
1/2
Using the prior yr's production profile as a baseline, the first charts YTD production levels compared w/the most recent F'cast (now SPRING25). W/42% of FY26 done, YTD avg (red) running -14kbd (-3%) v. F'cast.
1/2

December 4, 2025 at 4:00 PM
The Thursday Charts| We publish two charts Thursdays. #akleg
Using the prior yr's production profile as a baseline, the first charts YTD production levels compared w/the most recent F'cast (now SPRING25). W/42% of FY26 done, YTD avg (red) running -14kbd (-3%) v. F'cast.
1/2
Using the prior yr's production profile as a baseline, the first charts YTD production levels compared w/the most recent F'cast (now SPRING25). W/42% of FY26 done, YTD avg (red) running -14kbd (-3%) v. F'cast.
1/2
Several in the Top20% claim it's ok to tax the PFD b/c it's "free money." But, turns out, that's only a cover for shifting the benefit of the "free money" to their bank accounts instead. #akleg

Brad Keithley’s Chart of the Week: The $100,000 Dividend
Last month we wrote a couple of columns on these pages discussing the Tax Avoidance Dividend (or TAD). The TAD is the flip side of the Permanent Fund Dividend (PFD). The PFD is the portion of…
buff.ly
December 3, 2025 at 11:30 PM
Several in the Top20% claim it's ok to tax the PFD b/c it's "free money." But, turns out, that's only a cover for shifting the benefit of the "free money" to their bank accounts instead. #akleg
The Wednesday Chart| To help better understand the primary market for ANS, we look at the supply to USWC refiners each Wed:
YTD 2025 avg USWC (approx % of pre (2019)- and post (2022)-COVID levels):
> Crude demand: 85% & 94%;
> Domestic share: 76% & 88%.
#akleg
YTD 2025 avg USWC (approx % of pre (2019)- and post (2022)-COVID levels):
> Crude demand: 85% & 94%;
> Domestic share: 76% & 88%.
#akleg

December 3, 2025 at 10:00 PM
The Wednesday Chart| To help better understand the primary market for ANS, we look at the supply to USWC refiners each Wed:
YTD 2025 avg USWC (approx % of pre (2019)- and post (2022)-COVID levels):
> Crude demand: 85% & 94%;
> Domestic share: 76% & 88%.
#akleg
YTD 2025 avg USWC (approx % of pre (2019)- and post (2022)-COVID levels):
> Crude demand: 85% & 94%;
> Domestic share: 76% & 88%.
#akleg
This Week's Alaska Landmine Column| This week, we explain how, by using PFD cuts to fund state government, the Legislature is deepening the disconnect between the Alaska economy, as reflected in GDP, and Alaska household income. #akleg
Brad Keithley’s Chart of the Week: How the Legislature is deepening the disconnect between Alaska and Alaskans
In last week’s column, we compared nominal growth in Alaska’s Gross Domestic Product (GDP) to “real”...… Read More
buff.ly
December 3, 2025 at 8:30 PM
This Week's Alaska Landmine Column| This week, we explain how, by using PFD cuts to fund state government, the Legislature is deepening the disconnect between the Alaska economy, as reflected in GDP, and Alaska household income. #akleg
Some support #Begich4Gov b/c he proposes raising #OilTaxes & closing the S-Corp loophole. Both are good, but he also would con't DEEP PFDcuts ("most regressive tax ever proposed"), raising more from middle- & lower-income #AKfams than from #OilCos. #akleg buff.ly/Hn6TZXD

December 3, 2025 at 7:01 PM
Some support #Begich4Gov b/c he proposes raising #OilTaxes & closing the S-Corp loophole. Both are good, but he also would con't DEEP PFDcuts ("most regressive tax ever proposed"), raising more from middle- & lower-income #AKfams than from #OilCos. #akleg buff.ly/Hn6TZXD
The 8:35a Chart| Given the importance of Permanent Fund returns to #AKrev levels, we have developed a second morning chart focusing on S&P 500 5-, 3- & 1-yr returns v the PFC's. #akleg
* 5-yr: S&P 13.23% v PFC 9.59%
* 3-yr: S&P 18.81% v PFC 9.76%
* 1-yr: S&P 12.94% v PFC 11.51%
* 5-yr: S&P 13.23% v PFC 9.59%
* 3-yr: S&P 18.81% v PFC 9.76%
* 1-yr: S&P 12.94% v PFC 11.51%

December 3, 2025 at 5:35 PM
The 8:30a Chart| To provide context to current $$oil, we publish daily (ex-Su) a running avg of FY26-32 $$ANS, Brent & WTI actual+futures. Projected ANS v. SPRING25 rev F'cast:
> FY26 ⬆️ $1 (+$58mil UGF)
> FY27 ⬇️ $4 (-$133mil)
> FY28-32 even (avg annual $0mil)
#akleg
> FY26 ⬆️ $1 (+$58mil UGF)
> FY27 ⬇️ $4 (-$133mil)
> FY28-32 even (avg annual $0mil)
#akleg

December 3, 2025 at 5:30 PM
The 8:30a Chart| To provide context to current $$oil, we publish daily (ex-Su) a running avg of FY26-32 $$ANS, Brent & WTI actual+futures. Projected ANS v. SPRING25 rev F'cast:
> FY26 ⬆️ $1 (+$58mil UGF)
> FY27 ⬇️ $4 (-$133mil)
> FY28-32 even (avg annual $0mil)
#akleg
> FY26 ⬆️ $1 (+$58mil UGF)
> FY27 ⬇️ $4 (-$133mil)
> FY28-32 even (avg annual $0mil)
#akleg