Proportional Commons
@propvoting.bsky.social
4.1K followers 490 following 1.1K posts
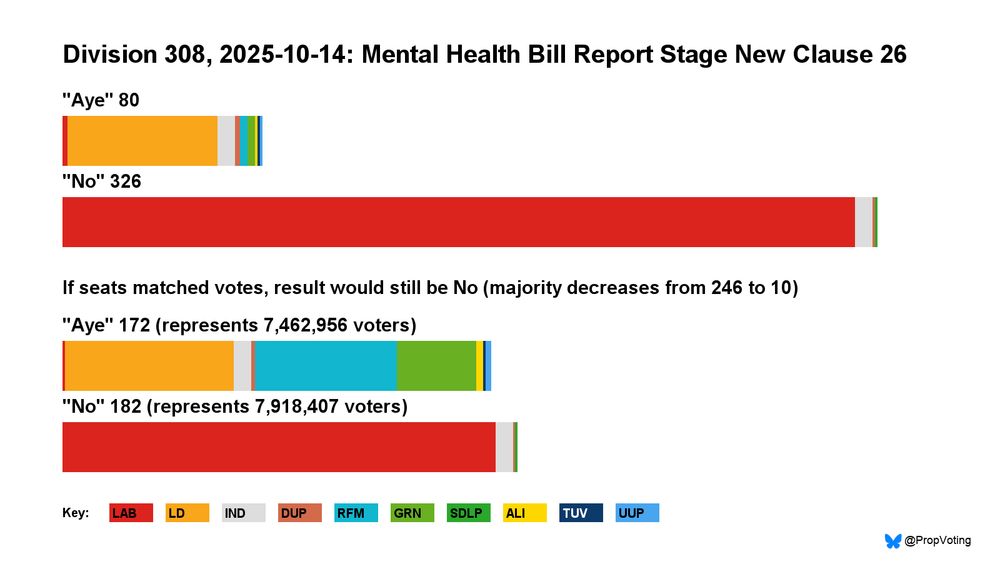
Recounting UK House of Commons divisions in proportion to the GE24 popular vote. See FAQ: http://tinyurl.com/4hxyc8e7 #MakeVotesMatter #ProportionalRepresentation Previously @PropVoting on Twitter.
Posts Media Videos Starter Packs
Pinned
propvoting.bsky.social
This chart is a summary of proportional recounts of votes in the House of Commons, since 2016.

Each bar shows one session, started by a King or Queen's speech. The height of the bar indicates the percentage of votes on legislation that went the wrong way in that session, because of FPTP distortion.
This chart is a summary of proportional recounts of votes in the House of Commons, since 2016.

Each bar shows one session, started by a King or Queen's speech. The height of the bar indicates the percentage of votes on legislation that went the wrong way in that session, because of First Past the Post (FPTP) distortion.

On average, more voters are represented by the MPs on the losing side. This is because seats don't match popular votes with FPTP. Recounts are calculated in terms of ideal MPs who all represent the same number of people. See @propvoting.bsky.social for analysis of each vote.

The method is not a simulation of a PR elected Commons. It is intended to highlight the distortion of FPTP.

For more details, see the FAQ: https://tinyurl.com/4hxyc8e7
propvoting.bsky.social
There were three divisions in the debate, none of which would have changed result if seats matched votes.

See ALT text.
This chart is a proportional recount of a vote in the House of Commons.

The top two bars show the number of MPs from each party who voted Aye or No in the division.

The bottom two bars show the number of voters those MPs represent. For example, if a party won two million votes in the general election and half of that party's MPs voted in the division, that would represent one million voters.

In many cases, more voters are represented by the MPs on the losing side. This is because seats don't match votes with First Past the Post (FPTP). Recounts are shown in terms of ideal MPs who all represent the same number of people.

The method is not a simulation of a PR elected Commons. It is intended to highlight the distortion of FPTP.

For more details, see the FAQ: https://tinyurl.com/4hxyc8e7 This chart is a proportional recount of a vote in the House of Commons.

The top two bars show the number of MPs from each party who voted Aye or No in the division.

The bottom two bars show the number of voters those MPs represent. For example, if a party won two million votes in the general election and half of that party's MPs voted in the division, that would represent one million voters.

In many cases, more voters are represented by the MPs on the losing side. This is because seats don't match votes with First Past the Post (FPTP). Recounts are shown in terms of ideal MPs who all represent the same number of people.

The method is not a simulation of a PR elected Commons. It is intended to highlight the distortion of FPTP.

For more details, see the FAQ: https://tinyurl.com/4hxyc8e7
propvoting.bsky.social
This amendment would require the designated counterparty to prioritise UK-based technology when entering contracts.
propvoting.bsky.social
2025-10-15: Sustainable Aviation Fuel Remaining Stages: Amendment 9

The 158 MPs voting 'Aye' represented 8,588,512 voters.
The 322 MPs voting 'No' represented 8,745,583 voters.

No majority = 157,071

See ALT text and 🧵
This chart is a proportional recount of a vote in the House of Commons.

The top two bars show the number of MPs from each party who voted Aye or No in the division.

The bottom two bars show the number of voters those MPs represent. For example, if a party won two million votes in the general election and half of that party's MPs voted in the division, that would represent one million voters.

    2025-10-15: Sustainable Aviation Fuel Remaining Stages: Amendment 9

    The 158 MPs voting 'Aye' represented 8,588,512 voters.
    The 322 MPs voting 'No' represented 8,745,583 voters.

In many cases, more voters are represented by the MPs on the losing side. This is because seats don't match votes with First Past the Post (FPTP). Recounts are shown in terms of ideal MPs who all represent the same number of people.

The method is not a simulation of a PR elected Commons. It is intended to highlight the distortion of FPTP.

For more details, see the FAQ: https://tinyurl.com/4hxyc8e7
propvoting.bsky.social
This amendment would require the designated counterparty to report on the impact that the revenue certainty mechanism has on passenger air fares.
propvoting.bsky.social
2025-10-15: Sustainable Aviation Fuel Bill Remaining Stages: Amendment 8

The 150 MPs voting 'Aye' represented 8,113,815 voters.
The 314 MPs voting 'No' represented 8,515,795 voters.

No majority = 401,980

See ALT text and 🧵
This chart is a proportional recount of a vote in the House of Commons.

The top two bars show the number of MPs from each party who voted Aye or No in the division.

The bottom two bars show the number of voters those MPs represent. For example, if a party won two million votes in the general election and half of that party's MPs voted in the division, that would represent one million voters.

    2025-10-15: Sustainable Aviation Fuel Bill Remaining Stages: Amendment 8

    The 150 MPs voting 'Aye' represented 8,113,815 voters.
    The 314 MPs voting 'No' represented 8,515,795 voters.

In many cases, more voters are represented by the MPs on the losing side. This is because seats don't match votes with First Past the Post (FPTP). Recounts are shown in terms of ideal MPs who all represent the same number of people.

The method is not a simulation of a PR elected Commons. It is intended to highlight the distortion of FPTP.

For more details, see the FAQ: https://tinyurl.com/4hxyc8e7
propvoting.bsky.social
2025-10-15: Sustainable Aviation Fuel Bill Remaining Stages: New Clause 5

The 78 MPs voting 'Aye' represented 4,729,860 voters.
The 313 MPs voting 'No' represented 7,598,740 voters.

No majority = 2,868,880

See ALT text and 🧵
This chart is a proportional recount of a vote in the House of Commons.

The top two bars show the number of MPs from each party who voted Aye or No in the division.

The bottom two bars show the number of voters those MPs represent. For example, if a party won two million votes in the general election and half of that party's MPs voted in the division, that would represent one million voters.

    2025-10-15: Sustainable Aviation Fuel Bill Remaining Stages: New Clause 5

    The 78 MPs voting 'Aye' represented 4,729,860 voters.
    The 313 MPs voting 'No' represented 7,598,740 voters.

In many cases, more voters are represented by the MPs on the losing side. This is because seats don't match votes with First Past the Post (FPTP). Recounts are shown in terms of ideal MPs who all represent the same number of people.

The method is not a simulation of a PR elected Commons. It is intended to highlight the distortion of FPTP.

For more details, see the FAQ: https://tinyurl.com/4hxyc8e7
propvoting.bsky.social
There were three divisions in the debate, two of which would have changed outcome if seats matched votes.

See ALT text.
This chart is a proportional recount of a vote in the House of Commons.

The top two bars show the number of MPs from each party who voted Aye or No in the division.

The bottom two bars show the number of voters those MPs represent. For example, if a party won two million votes in the general election and half of that party's MPs voted in the division, that would represent one million voters.

In many cases, more voters are represented by the MPs on the losing side. This is because seats don't match votes with First Past the Post (FPTP). Recounts are shown in terms of ideal MPs who all represent the same number of people.

The method is not a simulation of a PR elected Commons. It is intended to highlight the distortion of FPTP.

For more details, see the FAQ: https://tinyurl.com/4hxyc8e7 This chart is a proportional recount of a vote in the House of Commons.

The top two bars show the number of MPs from each party who voted Aye or No in the division.

The bottom two bars show the number of voters those MPs represent. For example, if a party won two million votes in the general election and half of that party's MPs voted in the division, that would represent one million voters.

In many cases, more voters are represented by the MPs on the losing side. This is because seats don't match votes with First Past the Post (FPTP). Recounts are shown in terms of ideal MPs who all represent the same number of people.

The method is not a simulation of a PR elected Commons. It is intended to highlight the distortion of FPTP.

For more details, see the FAQ: https://tinyurl.com/4hxyc8e7 This chart is a proportional recount of a vote in the House of Commons.

The top two bars show the number of MPs from each party who voted Aye or No in the division.

The bottom two bars show the number of voters those MPs represent. For example, if a party won two million votes in the general election and half of that party's MPs voted in the division, that would represent one million voters.

In many cases, more voters are represented by the MPs on the losing side. This is because seats don't match votes with First Past the Post (FPTP). Recounts are shown in terms of ideal MPs who all represent the same number of people.

The method is not a simulation of a PR elected Commons. It is intended to highlight the distortion of FPTP.

For more details, see the FAQ: https://tinyurl.com/4hxyc8e7
propvoting.bsky.social
Not every vote. But quite a few, yes. Stats available 🙂
propvoting.bsky.social
This amendment would stipulate that the nominated person for a patient under the age of 16 must have parental responsibility for the patient, unless there are safeguarding concerns.
propvoting.bsky.social
2025-10-14: Mental Health Bill Report Stage: Amendment 41

The 164 MPs voting 'Aye' represented 10,293,880 voters.
The 331 MPs voting 'No' represented 9,336,985 voters.

Aye majority = 956,895

But result was No because seats don't match votes. See ALT text and 🧵
This chart is a proportional recount of a vote in the House of Commons.

The top two bars show the number of MPs from each party who voted Aye or No in the division.

The bottom two bars show the number of voters those MPs represent. For example, if a party won two million votes in the general election and half of that party's MPs voted in the division, that would represent one million voters.

    2025-10-14: Mental Health Bill Report Stage: Amendment 41

    The 164 MPs voting 'Aye' represented 10,293,880 voters.
    The 331 MPs voting 'No' represented 9,336,985 voters.

In many cases, more voters are represented by the MPs on the losing side. This is because seats don't match votes with First Past the Post (FPTP). Recounts are shown in terms of ideal MPs who all represent the same number of people.

The method is not a simulation of a PR elected Commons. It is intended to highlight the distortion of FPTP.

For more details, see the FAQ: https://tinyurl.com/4hxyc8e7
propvoting.bsky.social
This amendment would require consideration to be given to public safety in care and treatment plans.
propvoting.bsky.social
2025-10-14: Mental Health Bill Report Stage: Amendment 40

The 163 MPs voting 'Aye' represented 11,153,820 voters.
The 335 MPs voting 'No' represented 9,511,306 voters.

Aye majority = 1,642,514

But result was No because seats don't match votes. See ALT text and 🧵
This chart is a proportional recount of a vote in the House of Commons.

The top two bars show the number of MPs from each party who voted Aye or No in the division.

The bottom two bars show the number of voters those MPs represent. For example, if a party won two million votes in the general election and half of that party's MPs voted in the division, that would represent one million voters.

    2025-10-14: Mental Health Bill Report Stage: Amendment 40

    The 163 MPs voting 'Aye' represented 11,153,820 voters.
    The 335 MPs voting 'No' represented 9,511,306 voters.

In many cases, more voters are represented by the MPs on the losing side. This is because seats don't match votes with First Past the Post (FPTP). Recounts are shown in terms of ideal MPs who all represent the same number of people.

The method is not a simulation of a PR elected Commons. It is intended to highlight the distortion of FPTP.

For more details, see the FAQ: https://tinyurl.com/4hxyc8e7
propvoting.bsky.social
This new clause would require hospitals to establish a dedicated liaison service for the carers of patients detained under the Mental Health Act.
propvoting.bsky.social
2025-10-14: Mental Health Bill Report Stage New Clause 26

The 80 MPs voting 'Aye' represented 7,462,956 voters.
The 326 MPs voting 'No' represented 7,918,407 voters.

No majority = 455,451

See ALT text and 🧵
This chart is a proportional recount of a vote in the House of Commons.

The top two bars show the number of MPs from each party who voted Aye or No in the division.

The bottom two bars show the number of voters those MPs represent. For example, if a party won two million votes in the general election and half of that party's MPs voted in the division, that would represent one million voters.

    2025-10-14: Mental Health Bill Report Stage New Clause 26

    The 80 MPs voting 'Aye' represented 7,462,956 voters.
    The 326 MPs voting 'No' represented 7,918,407 voters.

In many cases, more voters are represented by the MPs on the losing side. This is because seats don't match votes with First Past the Post (FPTP). Recounts are shown in terms of ideal MPs who all represent the same number of people.

The method is not a simulation of a PR elected Commons. It is intended to highlight the distortion of FPTP.

For more details, see the FAQ: https://tinyurl.com/4hxyc8e7
propvoting.bsky.social
The cruelty of modular arithmetic. But on the plus side, you won't age at all for 12 months thereafter 🙂

Happy tomorrow, and many more to come.
propvoting.bsky.social
And, it would seem, the apostrophe 😬
propvoting.bsky.social
Let me hallucinate that for you? 🤔😳
propvoting.bsky.social
Or, I might add, if you are a Linux person 🤓. No fuss, they just work.
propvoting.bsky.social
One hopes Parliament will have a say in this. Though then we run into problems because seats don't match votes 🤷‍♂️🤦‍♂️
propvoting.bsky.social
And no amount of rational explanation will change their minds 😔