


Norma B Gordon
@normabgordon.bsky.social
640 followers
130 following
150 posts
🧮 ♾️ Math Ed mentor and coachteacher, normabgordon.com/mathitations
🧘🏽♀️LYT Method® (RYT) normabgordon.com/yoga - sliding scale for educators
Posts
Media
Videos
Starter Packs


Reposted by Norma B Gordon


Reposted by Norma B Gordon


Norma B Gordon
@normabgordon.bsky.social
· Sep 28

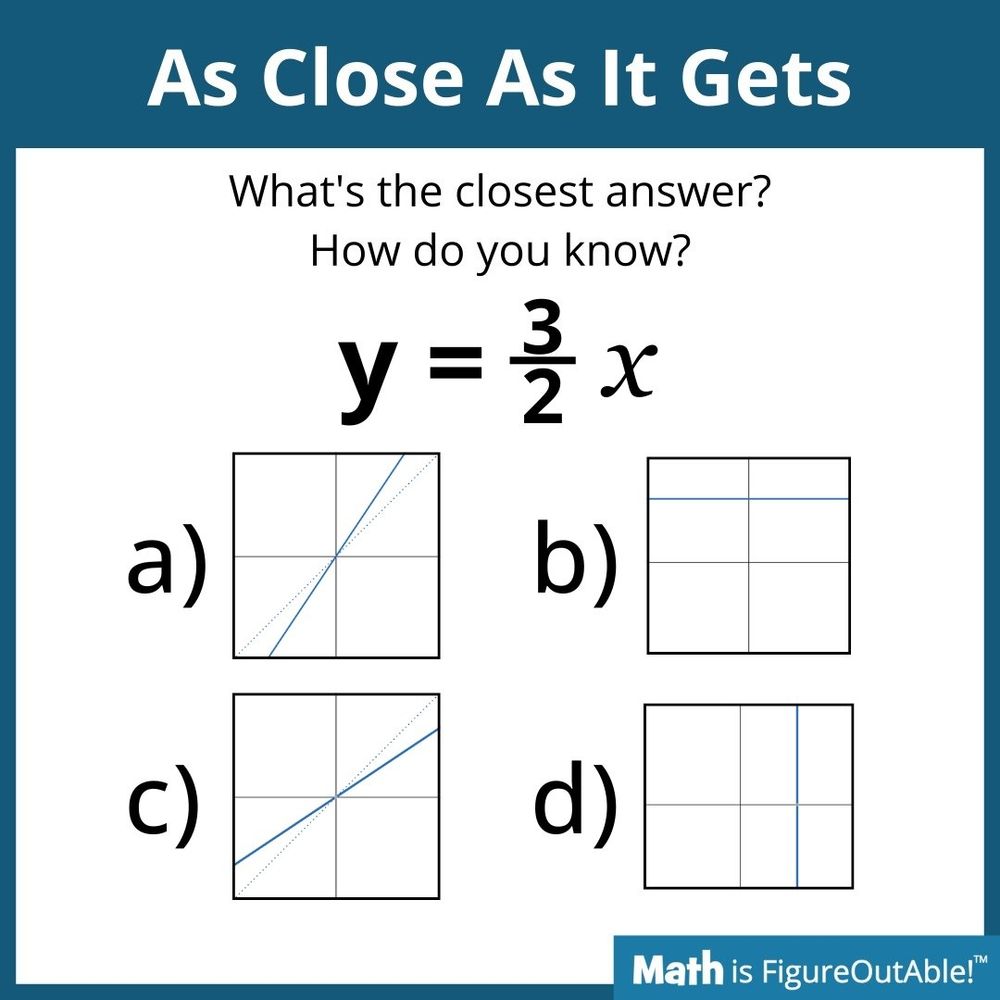
In math and science classes: “What if instead of asking who has the answer, we ask who has the method to solve it?”
#ITeachMath #MathSky #ITeachScience #EduSky
#ITeachMath #MathSky #ITeachScience #EduSky

Reposted by Norma B Gordon


The New York Times Learning Network is going to be publishing four lessons over the next four weeks on Tuesdays, based on my Math, Revealed series from a few months ago. Here's the first installment: www.nytimes.com/2025/09/16/l...

Teach Taxicab Geometry With Steven Strogatz and The New York Times
www.nytimes.com
Reposted by Norma B Gordon

What are we missing when we talk about NYC Solves or any math education initiative? How about culture and outcomes?! Read on for more here!

Why Teaching Math for Test Results Is Not Enough
Over the last year, New York City has had a fascinating discussion about teaching math. In particular, NYC Department of Education has started to implement a program called NYC Solves, a parallel program to the lauded NYC Reads initiative. NYC Solves hopes to narrow the math achievement gap through a uniform curriculum for the nation's largest public school system. On the one hand, a common language with a narrow funnel for support and training…
thejosevilson.com
Reposted by Norma B Gordon


Norma B Gordon
@normabgordon.bsky.social
· Sep 10
Let's see...https://open.substack.com/pub/normabgordonmath/p/starting-somewherefive-eight-five?r=6joyw&utm_campaign=post&utm_medium=web&showWelcomeOnShare=true


Reposted by Norma B Gordon

Jenna Laib
@jennalaib.bsky.social
· Aug 2
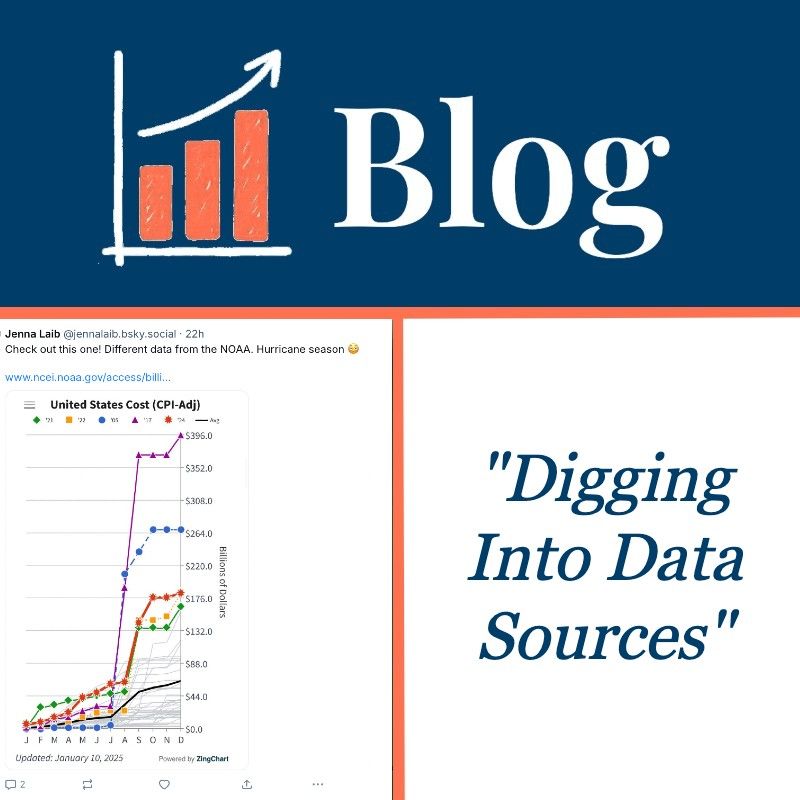
Blog: Digging Into Data Sources
by Jenna Laib "Data" is not neutral. When we look at a data visualization, it can feel cool and objective -- maybe even authoritative. But every graph, chart, or infographic has been shaped by a series of human decisions. Someone decided what to measure and how to measure it. Someone then decided what data to include (or exclude), how to scale the axes, and what labels to use.
slowrevealgraphs.com
Reposted by Norma B Gordon


Reposted by Norma B Gordon

Melynee Naegele
@mnmmath.bsky.social
· Jul 30
1/ 🚀 Want to lead #ElemMathChat this year? YOU are the perfect passionate math educator to guide one or more of our weekly chats. Sign up now & shape the convo! 👉 docs.google.com/spreadsheets... #ElemMathChat #MTBoS #ITeachMath


