Mitchell Thorson
banner
mitchellthorson.com
Mitchell Thorson
@mitchellthorson.com
690 followers 620 following 41 posts
Lead data visualization engineer at the Urban Institute. Otherwise reading books, riding bikes, listening to music, or talking a walk. 💻 mitchellthorson.com 📍 Brooklyn, NY
Posts Media Videos Starter Packs
Pinned
Hello to all new followers, here's quick intro post.

I'm Mitchell, I make data visualizations and build websites. I work at @urbaninstitute.bsky.social, and I used to work at USA Today where I contributed to a lot of award winning projects. 📊

Learn more at my website! www.mitchellthorson.com
Mitchell Thorson
Mitchell is a data visualization specialist, web developer and information designer.
www.mitchellthorson.com
Did you know that nearly half of families in the US with children under 4 struggle to afford diapers?

📊 A new data tool from @urbaninstitute.bsky.social looks at data in states and counties to understand where the largest gaps are.

www.urban.org/data-tools/m...
Excited to share this new piece from @urbaninstitute.bsky.social @wcurrangroome.bsky.social @andrewrumbach.bsky.social @sara-mctarnaghan.bsky.social and team that gives an excellent data-driven overview of the last 20 years of natural disasters and federal spending in Gulf Coast states. Lots of 📊!
Reposted by Mitchell Thorson
New visual story: Inside the relentless race for AI capacity

The quest for superintelligence is spurring a data centre boom — but critics question the cost, environmental impact and whether it is all needed

ig.ft.com/ai-data-cent...
When I read Mood Machine earlier this year, I began seriously thinking about cancelling my Spotify sub. This piece from @hearingthingsco.bsky.social finally pushed me to act. I've been buying more music from @bandcamp.com, and from now on I'll be using a different platform for streaming.
I don’t know how any ardent music fan could read @lizpelly.bsky.social's book 𝘔𝘰𝘰𝘥 𝘔𝘢𝘤𝘩𝘪𝘯𝘦 and *not* be moved to cancel their Spotify subscription
Why We Quit Spotify
Enough is enough
www.hearingthings.co
Reposted by Mitchell Thorson
Cremieux’s real name is Jordan Lasker. I put his name in the newspaper. He’s a scientific racist www.theguardian.com/us-news/2025...
Reposted by Mitchell Thorson
New case study up on my redesigned website! Full process of building a custom #datavisualization tool: brainstorming and prototyping to refining the UX through cross-functional teamwork and creative problem-solving! Inspired by @alv9n.com's great project walkthroughs!
Ben Kates - Case Study: Getting a Good Job Depends More on Race and Gender than Education
Ben is a data-focused technologist based in Philadelphia, PA creating custom data experiences for clients across industries.
benkates.com
This week, @urbaninstitute.bsky.social launched the Education-to-Workforce Framework data tool.

This was one of the more complex @svelte.dev apps we've built, and @benkates.com led the way on development and made something really cool with this one.

apps.urban.org/features/edu...
This is really great! Thanks for sharing.
Reposted by Mitchell Thorson
Learn ggplot from the best in the field! 👇
This is also super interesting for my friends in science and their research groups.
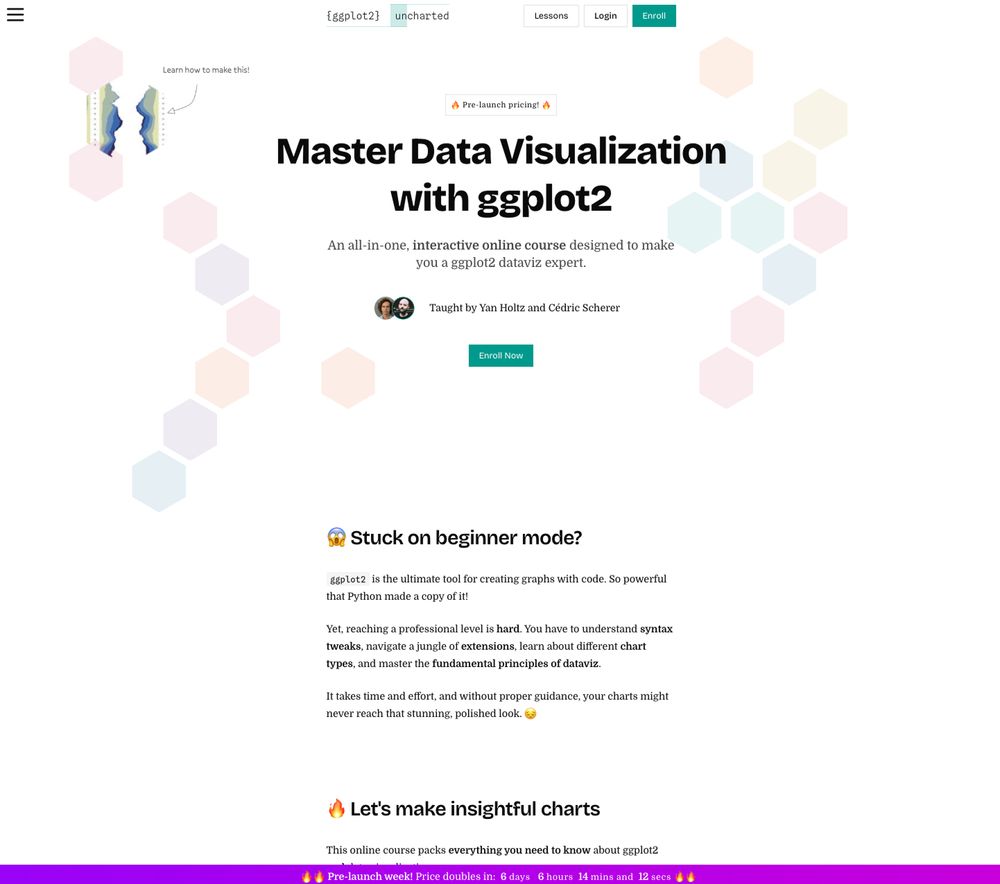
Excited to launch "ggplot2 [un]charted" with @yan-holtz.bsky.social! 🎉

An online course to master #ggplot2 with exercises, quizzes, and modules—and hands-on code running in your browser!

Still WIP—sign up now for a limited discount:
👉 www.ggplot2-uncharted.com

#rstats #DataViz #DataVisualization
Reposted by Mitchell Thorson
NYC’s congestion pricing is a policy miracle: Less traffic, less noise, faster transit, more business sales, more transit revenue. And it hasn’t produced the negative effects outside the cordon zone we were afraid of.

www.nytimes.com/interactive/...
Reposted by Mitchell Thorson
New data tool launch today 🚨 @urbaninstitute.bsky.social's Federal Infrastructure site.

It includes detailed information on funds from 110 programs across all states, counties & metro areas.

Tool pinpoints the support that communities receive for transportation, housing, energy, water & broadband.
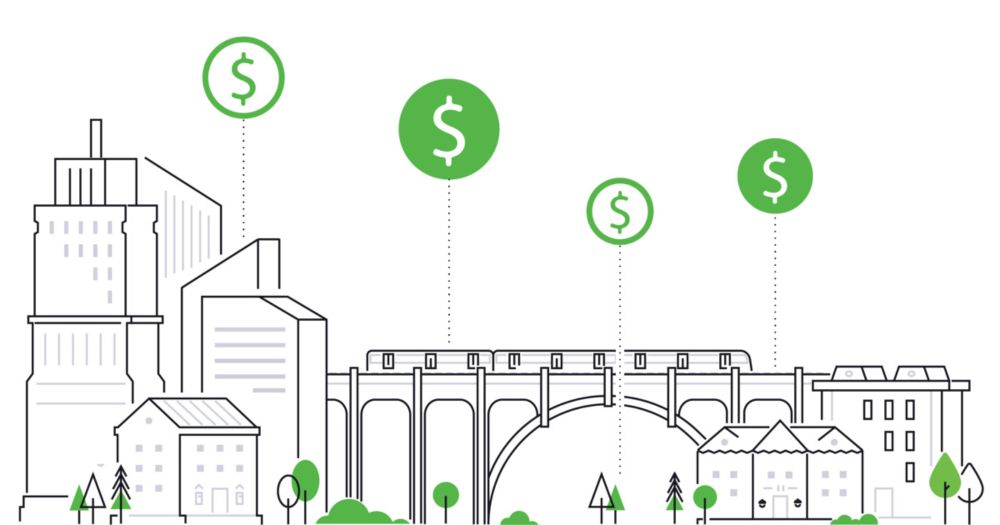
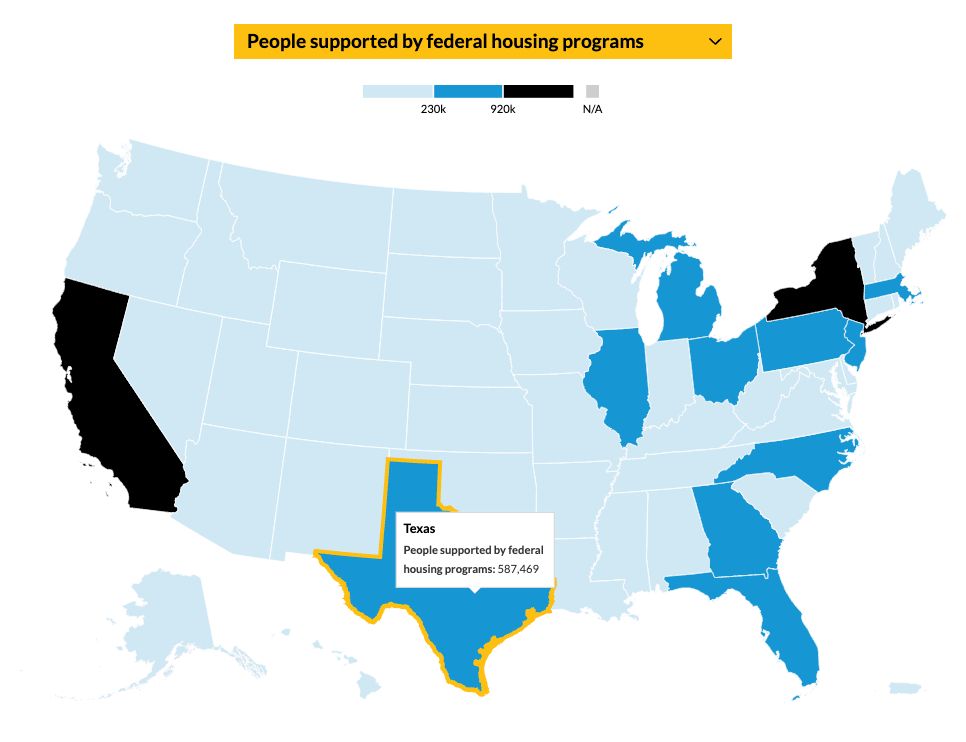
Are Federal Infrastructure Dollars Meeting Your Community’s Needs?
Data analysis tracking whether the billions in funding that the US has committed to its roads, bridges, housing, and other infrastructure are getting to the communities that need it most.
apps.urban.org
Reposted by Mitchell Thorson
Very gratifying to see three data visualization projects we worked on at @urbaninstitute.bsky.social longlisted at the Information is Beautiful awards.

Kudus to @mitchellthorson.com @benkates.com and @arobotwriting.bsky.social for their outstanding work bringing these complex datasets to life.
Reposted by Mitchell Thorson
For the German election we wanted to use a cartogram of German election districts but didn't find anything good, so we created our own. Here's a little nerd thread how the final algorithm worked 🤓 🧵 #gis #cartogram #election #datavis #cartography
Reposted by Mitchell Thorson
New research @urbaninstitute.bsky.social shows that mass deportations would likely worsen the housing shortage by decimating the labor force.

Immigrants make up >23% of the construction workforce & more in FL, TX. About half are estimated to be undocumented immigrants. www.urban.org/urban-wire/m...
Reposted by Mitchell Thorson
HUD programs support more than 5 million low-income households. They're now under threat of big cuts.

Our new data tool @urbaninstitute.bsky.social provides detailed info about people supported by HUD programs—and funds received—in every state & Congressional district: www.urban.org/data-tools/f...
Reposted by Mitchell Thorson
Dismantling the Dept of Ed or disrupting functions like enforcing critical civil rights laws or halting IDEA funding could affect students with disabilities across the US.

The number of public school students with Individualized Education Programs may surprise you:

www.urban.org/urban-wire/h...
Reposted by Mitchell Thorson
How long will housing recovery following LA's wildfires take? My team @urbaninstitute.bsky.social requested data on four recent fires and analyzed the recovery phases along three key milestones: 1) Debris removal 2) A building permit and 3)
Certificate of occupancy www.urban.org/urban-wire/w...
Reposted by Mitchell Thorson
Even among families who can afford most of their day-to-day needs, many cannot weather unexpected expenses, like trouble with their car or a visit to urgent care.

Urban has new analysis out showing, by state, how many families lack the resources to thrive.

www.urban.org/urban-wire/h...
Reposted by Mitchell Thorson
42% of Americans would live in a smaller home in a more walkable community.

Yet the reality is that, in most metro areas, those communities are few & far between—and they’re typically too expensive for many people to afford.

Work by @harrystevens.bsky.social www.washingtonpost.com/climate-envi...