Brian McNoldy
@bmcnoldy.bsky.social
13K followers 2.1K following 1.5K posts
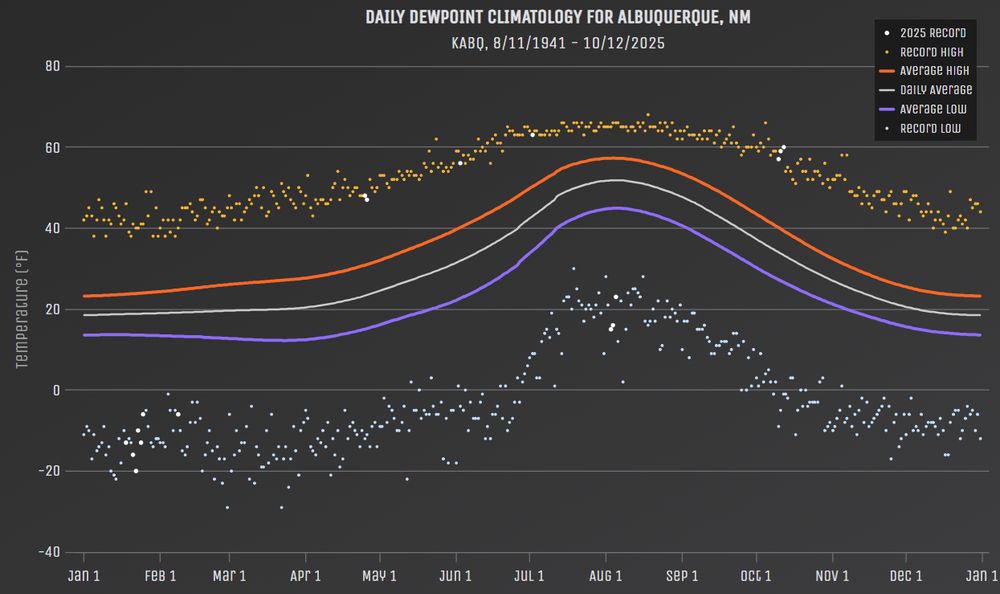
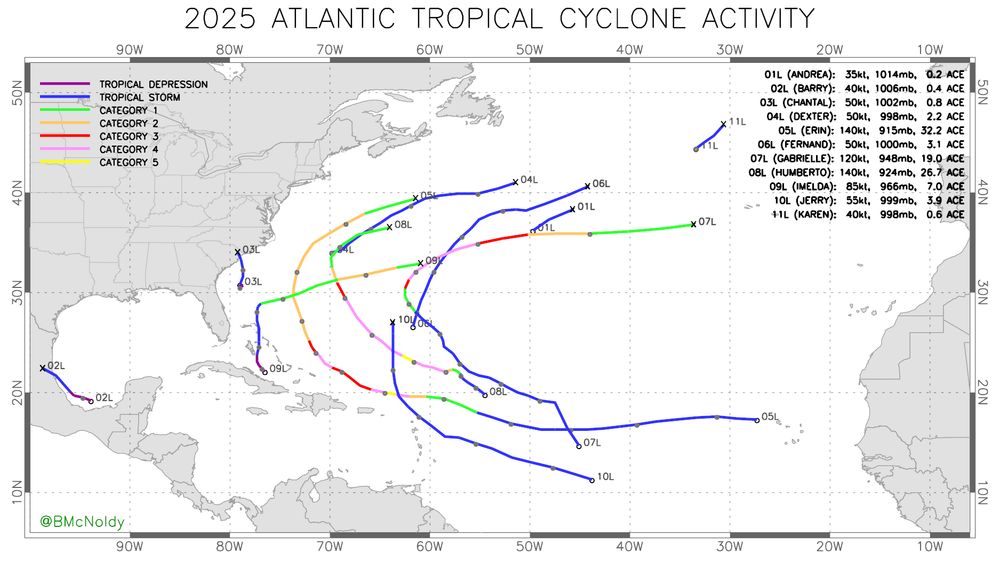
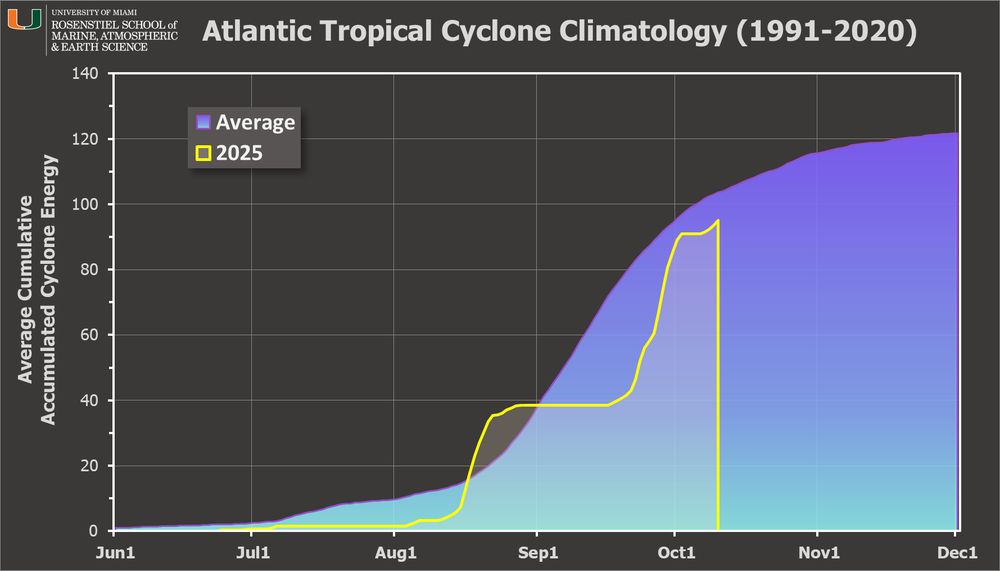
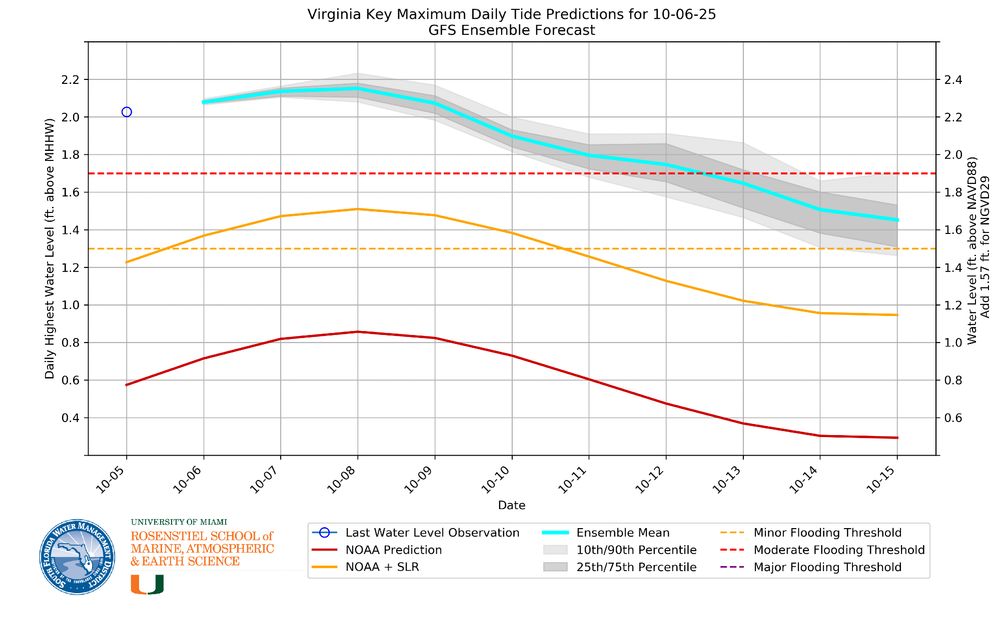
Univ. of Miami hurricane researcher 🌀 living in New Mexico 🏜. Husband and dog dad. 🏳️‍🌈 https://bmcnoldy.earth.miami.edu/
Posts Media Videos Starter Packs
bmcnoldy.bsky.social
The 60°F dewpoint today is now the highest value ever recorded during the entire span of October 12 through May 24!
[3/3]
bmcnoldy.bsky.social
As of 6am on the 12th, the dewpoint has been 50°F+ for 82 consecutive hours and counting. Sunday is also the third consecutive day with a record high dewpoint (57° on Friday, 59° on Saturday, and so far 60° on Sunday).
[2/3]
bmcnoldy.bsky.social
Record-smashing humidity in #Albuquerque...
In a streak that would be typical in the core of monsoon season, Albuquerque is in the midst of an unprecedented surge of moisture this late in the year.
[1/3]
bmcnoldy.bsky.social
No lack of storms this hurricane season, and certainly no shortage of major hurricanes -- but they've thankfully managed to avoid land for the most part.
The most impactful storm so far was Imelda's landfall on Bermuda.
But it's not over yet...
bmcnoldy.bsky.social
For example, Erin and Imelda were both hurricanes, but Erin had 4.6x more ACE. Imelda accrued roughly the same amount of ACE as Andrea, Barry, Chantal, Dexter, Fernand, and Karen combined.
bmcnoldy.bsky.social
The Accumulated Cyclone Energy (ACE) is at 92% of average for the date this Atlantic hurricane season. Rather than counting storms, this metric accounts for the combined duration and intensity of whatever storms there were.

Climatologically, 15% of the season's ACE is still ahead.
bmcnoldy.bsky.social
The name was later retired, joining five previously-retired "M" storms: Marilyn '95, Mitch '98, Michelle '01, Matthew '16, and Maria '17. Then Milton '24 was retired as well, bringing the M tally to seven.
bmcnoldy.bsky.social
And just like the other U.S. Category 5 hurricane landfalls, Michael was also only a tropical storm three days before landfall.
bmcnoldy.bsky.social
Seven years ago today, Hurricane Michael continued to intensify as it headed north toward the coast. It made landfall near Mexico Beach FL with 160mph peak sustained winds, making it the 1st Category 5 landfall in the FL panhandle and only the 4th in U.S. history.
bmcnoldy.bsky.social
And meteorologist. We should have reserved window seats for life.
bmcnoldy.bsky.social
The significant ongoing tidal flooding event in the #Miami area is caused by a few coincident components:
1) the full moon on October 6, which happens to be near perigee (October 8)
2) sea level rise adds ~8 inches to the baseline sea level used in NOAA tide predictions

#KingTide
[1/2]
bmcnoldy.bsky.social
A tropical storm watch is in effect for the northern Leeward Islands, where tropical storm conditions could arrive on Thursday afternoon and then persist into the night as #Jerry makes its closest approach.
bmcnoldy.blogspot.com/2025/10/trop...
Tropical Storm Jerry to pass near Leeward Islands on Thursday night
Updates and summaries on tropical Atlantic activity... including easterly waves, tropical storms, subtropical storms, and hurricanes.
bmcnoldy.blogspot.com
bmcnoldy.bsky.social
Here are the corresponding sea surface temperature anomalies (°C). Multiply by 1.8 to get them in °F.
bmcnoldy.bsky.social
There is no conversion to degrees for this. It's a vertically-integrated energy over an area, so in this case, expressed in kiloJoules per square centimeter.
bmcnoldy.bsky.social
A trio of cyclonic eddies in the Gulf of Mexico are creating record-high Ocean Heat Content values for the date. Absolutely something of importance during this part of hurricane season.
@miamirosenstiel.bsky.social
bmcnoldy.bsky.social
If we convert the specific humidity thresholds to dewpoint, here's a map showing the extent of summertime "mugginess", where the average dewpoint is 65°F+ (northern blue contour line). The southern blue contour line shows the region where the average summertime dewpoint is a soupy 72°F+.
bmcnoldy.bsky.social
I'm thrilled to share this paper that was just published today in Climatic Change on the effect of "seasonally muggy" conditions that exacerbate chronic heat and thermal discomfort in places like south Florida.

doi.org/10.1007/s105...

Lead author: @weatherkos.bsky.social
Nighttime land surface temperature and thermal discomfort in a seasonally muggy climate - Climatic Change
Globally, increasing air moisture can limit not only the human body’s ability to cool down, but also that of the Earth’s surface. This interaction, however, remains understudied—especially across subtropical-to-tropical regions that experience high levels of humidity. Here, we examine how air moisture influences nighttime land surface temperatures (LSTs), as well as what this interaction means for thermal comfort overnight. During summer months across seasonally muggy Southern Florida, during which time air moisture reaches the highest values of any place in the United States, we examine: 1) how air moisture, measured as specific humidity, varies with urbanicity and geography; 2) whether air moisture limits LST cooling at night; and 3) the implications of increased air moisture and nighttime LSTs for thermal comfort overnight. Based on data from 30 weather stations, we find that nighttime LST remains higher and closer to daytime highs in areas with increased specific humidity, highlighting a decreased surface cooling phenomenon in more humid areas. Both urban and coastal areas exhibit higher nighttime LSTs that are strongly related to thermal discomfort—also resulting in more time spent at or above critical thresholds for thermal discomfort overnight. This analysis therefore underscores the importance of heat mitigation and adaptation strategies that reduce LSTs and anthropogenic heat inputs in seasonally muggy climates in order to increase thermal comfort, especially near coastlines at lower latitudes.
doi.org
bmcnoldy.bsky.social
Well, here we are: the morning of October 8 is upon us... and it's a doozy.
bmcnoldy.bsky.social
3) another 7-8 inches is coming from persistent onshore winds generated by a stationary high pressure system near Bermuda

[2/2]
bmcnoldy.bsky.social
The significant ongoing tidal flooding event in the #Miami area is caused by a few coincident components:
1) the full moon on October 6, which happens to be near perigee (October 8)
2) sea level rise adds ~8 inches to the baseline sea level used in NOAA tide predictions

#KingTide
[1/2]
bmcnoldy.bsky.social
Additionally, water levels have peaked above the moderate flooding threshold since Saturday morning and are forecast to continue into the weekend.
bmcnoldy.earth.miami.edu/tide/
[2/2]
Enhanced NOAA Tide Predictions
Ten-day tide forecasts for South Florida Tide Gauge Locations.
bmcnoldy.earth.miami.edu
bmcnoldy.bsky.social
Peak water levels in the #Miami area have been above the minor flooding threshold for the past four days, and our tide forecasts show that continuing for at least the next ten days! #KingTide
bmcnoldy.earth.miami.edu/tide/
[1/2]
bmcnoldy.bsky.social
Yikes... wait 'til you see it in another 5-7 days then!