Brian Fremeau
@bcfremeau.bsky.social
4.3K followers 310 following 320 posts
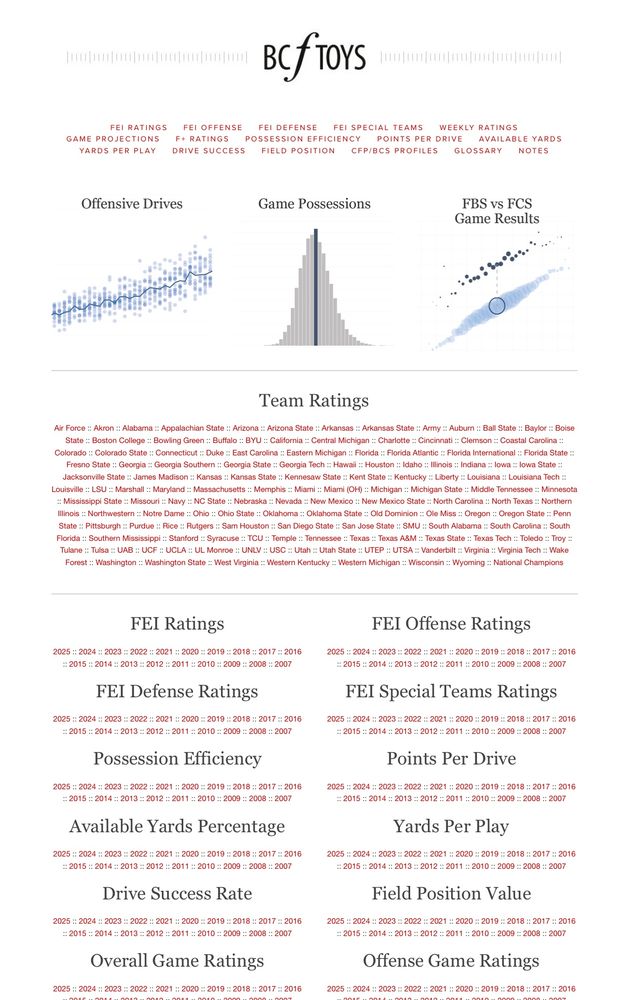
College football possession efficiency, FEI ratings, and data visualization enthusiast. Post an interesting chart, I'm probably going to like it. Post a college football dataviz, hello new best friend. https://www.bcftoys.com
Posts Media Videos Starter Packs
Pinned
bcfremeau.bsky.social
We’re back and (hopefully) better than ever. Let me know if anything on the relaunched site is wonky or anything, and let’s get the 2025 college football data season rolling: bcftoys.com
bcfremeau.bsky.social
Wins above what an average FBS team would expect to have against the schedule faced through Week 7, per FEI:
+3.9 Texas A&M
+3.8 Ohio State
+3.3 Indiana
+3.3 Ole Miss
+3.2 Miami
+3.0 Alabama
+2.8 Georgia
+2.5 LSU
+2.5 Georgia Tech
+2.4 Texas Tech
bcfremeau.bsky.social
FBS vs FBS games through Week 7...
52.6 points/game (fewest since 2009)
23.8 possessions/game (fewest since at least 2007)
2.21 points/possession (down slightly from 2024)
Three line series plots representing Points Per Game, Possessions Per Game, and Points Per Possession trends in FBS vs FBS games by season from 2007 to 2025
bcfremeau.bsky.social
Average game rating (opp-adjusted single game efficiency) through Week 7:
.938 Ohio St (average performance better than 93% of all FBS team games played this season)
.922 Indiana
.914 Texas Tech
.913 Georgia
.908 Oregon
.904 Notre Dame
.901 Miami
.877 Texas A&M
.861 Utah
.852 Alabama
bcfremeau.bsky.social
Sounds like you might be a fan of that strength of record set of columns
bcfremeau.bsky.social
If no preseason projection weight was applied...
1. Indiana
2. Miami
3. Notre Dame
4. Ohio State
5. Texas Tech
6. Alabama
7. Utah
8. Georgia
9. Oregon
10. Texas A&M
bcfremeau.bsky.social
FEI ratings and supporting metrics are updated through Week 7 results: bcftoys.com/2025-fei
Preseason projections carry 43% weight for teams that have played four FBS opponents, 33% if they have played five, 25% if they have played six, 18% if they have played seven.
Screenshot of FEI ratings top 15 data table through Week 7
bcfremeau.bsky.social
At the end of its opening drive vs Colorado on Saturday, Iowa State faced a 4th-and-12 at the Buffs 28-yard line. They took a delay of game penalty and punted on 4th-and-17 from the 33.
bcfremeau.bsky.social
120 minutes of game clock since 24-17 OT lead vs Oregon.
bcfremeau.bsky.social
Toughest remaining regular season schedule in terms of wins a top 20-30 FBS team would expect to have against it, per FEI:

2.6 Mississippi St
2.7 Alabama
2.7 Oklahoma
2.8 Kentucky
2.8 Auburn
3.0 Vanderbilt
3.0 Texas A&M
3.0 Wisconsin
3.1 Missouri
3.2 Florida
bcfremeau.bsky.social
Wins above what an average FBS team would expect to have against the schedule faced through Week 6, per FEI:
+3.1 Miami
+3.0 Texas A&M
+2.9 Ole Miss
+2.8 Ohio State
+2.3 Indiana
+2.3 Alabama
+2.2 Illinois
+2.1 Iowa State
+1.9 Oklahoma
+1.9 Georgia Tech
bcfremeau.bsky.social
13 FBS teams have scored at least 222 points this season through Week 6:
Vanderbilt, Virginia, Tennessee, Texas Tech, Memphis, USC, Indiana, Florida State, Oregon, Missouri, North Texas, UConn, Illinois
redditcfb.com
Today is the 109th anniversary of one wild day in football
bcfremeau.bsky.social
Starting field position differential is an interesting "core" metric. I've found that it does have a positive relationship with team strength, but not nearly as strong as offensive and defensive efficiency metrics do.
bcfremeau.bsky.social
Interesting to me that 7 of 12 core metrics are "raw" unadjusted statistics and five are "opponent-adjusted" (as in, calculated relative to opponent averages)
bcfremeau.bsky.social
But I also have more questions!
- Relative scoring offense and scoring defense; I'm curious if these metrics are calculated with *all* game points scored, or only those scored on offensive drives
- Same with points per possession (off/def), yards per point, and plays per point
bcfremeau.bsky.social
Love digging into these articles every year on the committee selection process, and this one has some intriguing details about the 12 metrics used as the "bedrock of team comparisons".
bcfremeau.bsky.social
FEI games of the year to date (based on the average of each team's opp-adjusted game ratings):

Alabama 24, Georgia 21
Ohio St 14, Texas 7
Oregon 30, Penn St 24
Georgia 44, Tennessee 41
Texas A&M 41, Notre Dame 40
Miami 27, Notre Dame 24
Ole Miss 24, LSU 19
Indiana 20, Iowa 15
bcfremeau.bsky.social
"Best losses" to date:
Tennessee vs Georgia (41-44)
Texas vs Ohio St (7-14)
Georgia vs Alabama (21-24)
Penn St vs Oregon (24-30)
ND vs Texas A&M (40-41)
ND vs Miami (24-27)
LSU vs Ole Miss (19-24)
Kentucky vs Ole Miss (19-24)
Iowa vs Indiana (15-20)
Nebraska vs Michigan (27-30)
bcfremeau.bsky.social
0% weight when a team has played 10 FBS opponents, or when we reach the end of the regular season, whichever comes first.
bcfremeau.bsky.social
90th+ percentile FEI game ratings vs FBS opponents through Week 6:

4x - Alabama
3x - Miami, Notre Dame, Ohio State, Oregon
2x - Florida State, Georgia, Illinois, Indiana, Oklahoma, Old Dominion, Ole Miss, Texas A&M, Texas Tech, Utah, Vanderbilt

bcftoys.com/2025-gr
2025 Game Ratings — BCF Toys
bcftoys.com
bcfremeau.bsky.social
FEI ratings and supporting metrics are updated through Week 6 results: bcftoys.com/2025-fei
Preseason projections carry 43% weight for teams that have played four FBS opponents, 33% for teams that have played five, 25% for teams that have played six.
Screenshot of FEI ratings table of top-15 teams through Week 6
bcfremeau.bsky.social
FEI ratings aren’t updated yet, they post each week by Tuesday morning