


Ana Prados
@aprados1.bsky.social
1.5K followers
1.9K following
4 posts
Scientist @UMBC working at the intersection of #disasters #risk #wildfires #airquality and #remotesensing
Posts
Media
Videos
Starter Packs
Ana Prados
@aprados1.bsky.social
· Jun 9
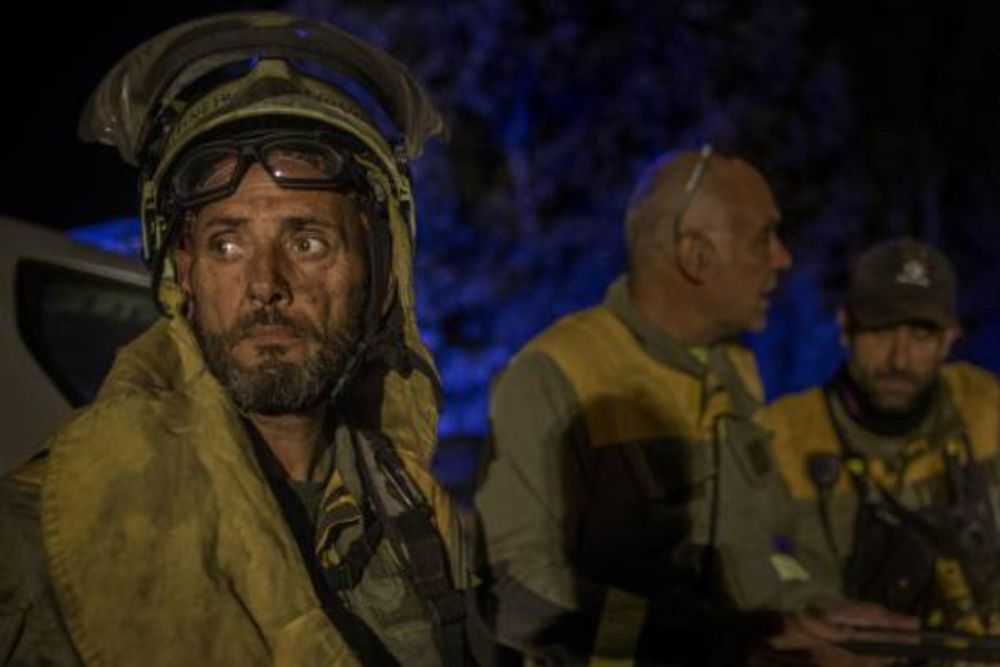
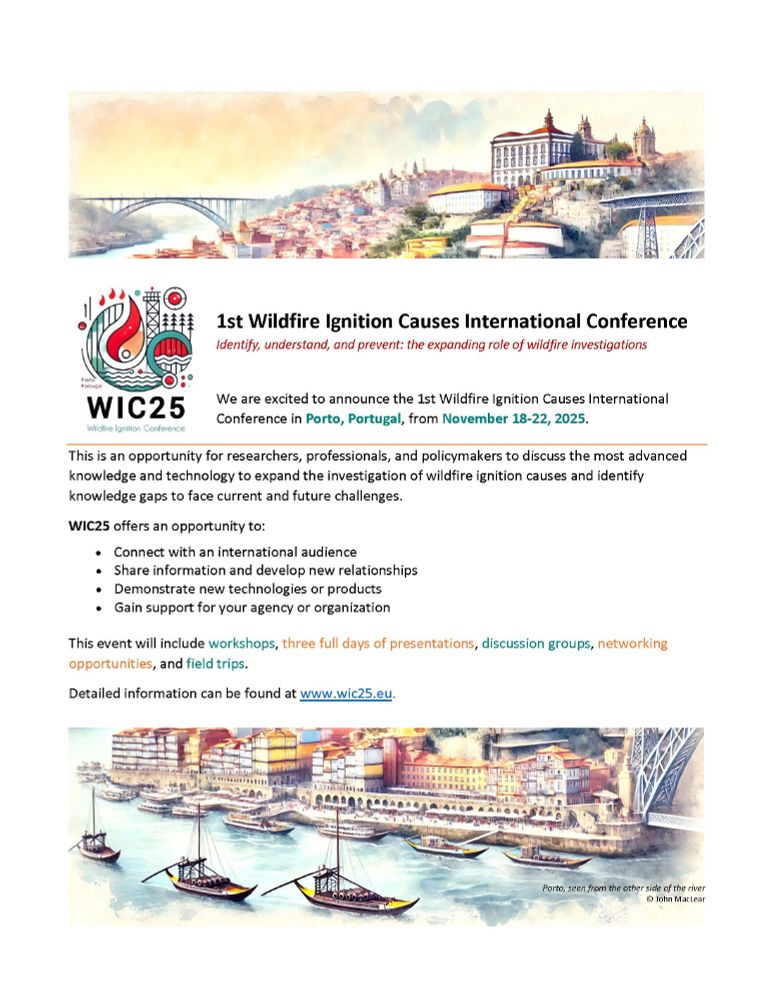
Vivir donde el fuego siempre vuelve
La lucha contra los incendios ha dejado de centrarse exclusivamente en la extinción. Hoy se plantea desde una óptica más ambiciosa y estructural, en la que la innovación tecnológica, la participación ciudadana y la gestión territorial son imprescindibles.
www.agenciasinc.es
Reposted by Ana Prados
Reposted by Ana Prados
Reposted by Ana Prados
Reposted by Ana Prados
Reposted by Ana Prados
Reposted by Ana Prados
Reposted by Ana Prados
Ilan Kelman
@ilankelman.bsky.social
· Oct 7
Reposted by Ana Prados
Mark Parrington
@mparrington.bsky.social
· Sep 24
Reposted by Ana Prados

Reposted by Ana Prados